Report No. 01 · Aedifice Research · 2026
Building Prosperity in New York
The Circular-Economy Case for the Built Environment
Jeremy Edwards, Aedifice Research · April 19, 2026
Chapter 01
The Stock
Chapter 1 · The Stock
What New York is built of
A cohort-by-borough atlas of the city's built inheritance: size, age, class, condition, embodied carbon.
New York stands on 1,076,507 buildings, 5.73 billion square feet of floor area, and approximately 357 megatonnes of embodied CO₂e. Ninety-four percent of the stock was built before the term “embodied carbon” entered construction practice in the mid-1990s. It is the largest carbon asset the city currently holds.
Standing stock
1.08M
buildings
Total floor area
5.73B
square feet
Embodied carbon
357
MtCO₂e
37,977 buildings
3.5%
landmark-protected
Abstract
Before a building is a flow it is an inventory; before it is a carbon cost it is an asset. The material that enters and leaves New York each year — the 4.2-to-1 disposal ratio measured in Chapter 4 — is a derivative of the inventory above the sidewalk. This is the opening accounting of a seven-chapter report on New York's circular built environment.
Joining the NYC Department of City Planning's MapPLUTO dataset to the Landmarks Preservation Commission's designation records, the Department of Citywide Administrative Services' owned-property registry, and the LL84 benchmarking roster of large buildings, we inventory every structure standing in the five boroughs as of the 2026 PLUTO release. Each structure is tagged with its construction era, its borough, its class, its preservation status, its ownership, and its coverage under the city's operational-carbon regime.
The result is a cohort-by-borough atlas of 1,076,507 buildings — roughly 5.73 billion square feet of floor area — carrying an estimated 357 megatonnes of embodied CO₂e, calculated by multiplying each cohort's floor area by analyst-derived era-specific intensity benchmarks, calibrated to Carbon Leadership Forum baseline ranges and the Inventory of Carbon and Energy (ICE) database. This is the carbon the city has already paid for. It does not appear on any ledger.
Three findings from this inventory reshape the chapters that follow. First, 42 percent of New York's floor area dates from a single forty-year window, 1900–1940 — a hinge on which every subsequent decision about preservation, retrofit, and replacement pivots. Second, only 3.5 percent of the city's buildings carry any form of landmark protection; the remaining 96.5 percent are structurally defenseless against replacement cycles. Third, Local Law 97 — the law most often cited as New York's climate regime — regulates the operational emissions of buildings representing 63 percent of the city's embedded carbon, but the embedded carbon itself remains unregulated. The report's central argument — that stewardship is climate policy, and that demolition is climate loss — begins with these three numbers.
1. The size of the stock
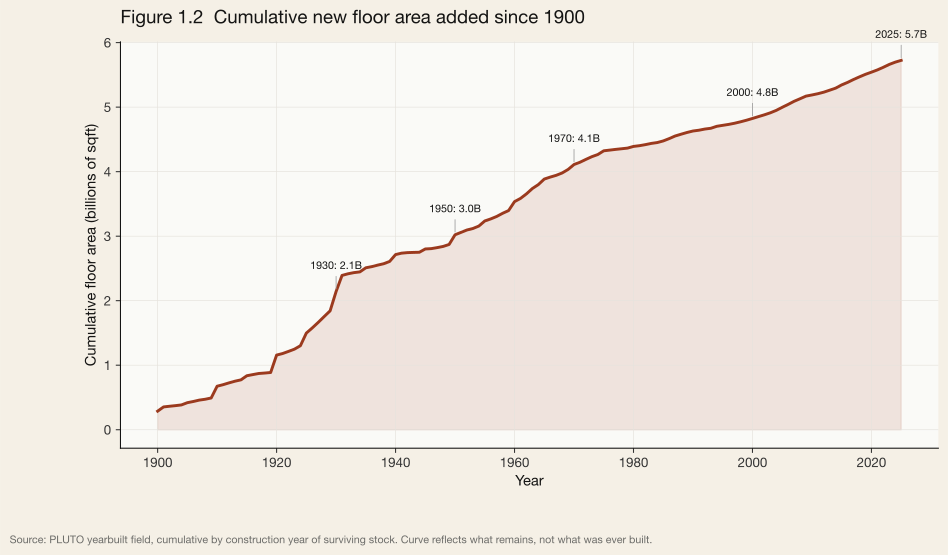
The PLUTO release cleaned for this chapter resolves to 818,108 tax lots with a valid recorded year of construction between 1801 and 2026. Aggregating across the the relevant fields field — which indicates multi-building compound lots — yields 1,076,507 discrete structures. The number is larger than the commonly cited 818,000 figure because that figure counts lots, not buildings; the 258,399 additional structures live on compound lots, most of them interior townhouses, campus buildings, and cemetery structures.
Together these structures total 5,725,198,495 square feet of floor area — 5.73 billion sqft. Distributed per capita across the city's 8.8 million residents, the stock is 651 sqft per person — above the U.S. metropolitan median of roughly 400 sqft per person (AHS, 2021) but well below the Sun Belt range of 700–900.
2. The age of the stock
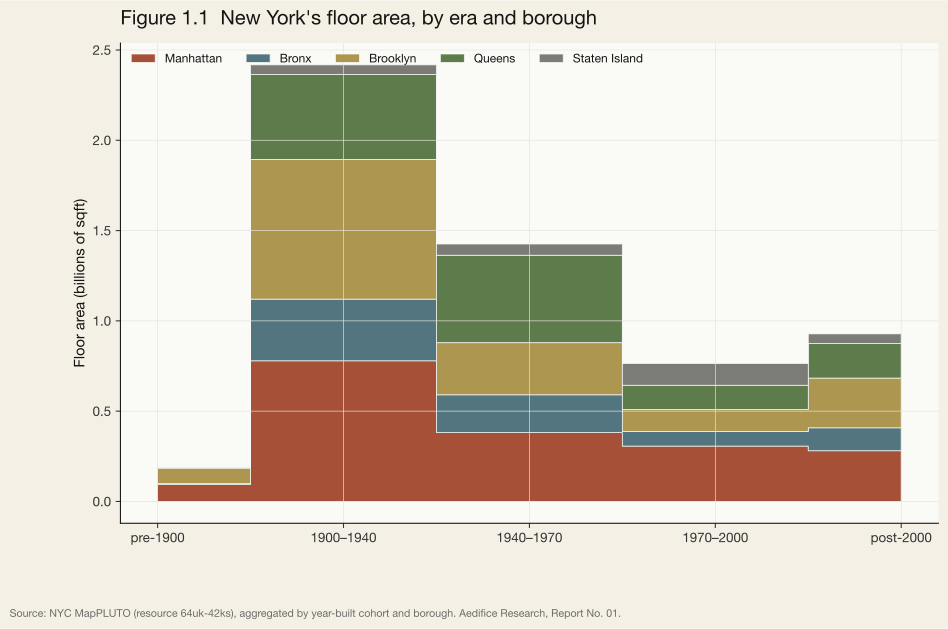
Of every ten square feet of New York, roughly four were built between 1900 and 1940. The 42-percent share that this single forty-year cohort claims is not an artifact of measurement. It is the geological signature of the city. The blocks and streetwalls laid during Manhattan's second commercial expansion, the five-story walk-ups that accommodated a tripling of Brooklyn's population between 1900 and 1930, the Queens row-house grid rolled out after the 1915 extension of the IRT subway — these are the city's load-bearing demographic cohort. They hold its embedded labor, its embedded material, and its embedded carbon.
The second-largest cohort by floor area, 1940–1970, is the postwar stock: Mitchell-Lama high-rises, curtain-wall commercial towers, the New York City Housing Authority's campus complexes. The 1970–2000 cohort is the smallest — a product both of the fiscal crisis that froze construction in the 1970s and of the comparatively restrained building pipeline of the 1980s. The post-2000 cohort, paradoxically, is larger than the 1970–2000 cohort in floor area (16.2 percent vs. 13.3 percent) despite spanning fewer years — a reflection of the scale of contemporary construction, dominated by larger buildings on smaller lots.
The era distribution matters because embodied-carbon intensity is not era-neutral. Older masonry stock carries roughly 45 kg of CO₂e per square foot; modern steel-and-glass carries closer to 75. The citywide average, weighted by cohort share, is 62 kg per square foot. The older stock is lower-carbon per square foot on both the embodied and the operational ledger, once passive-design advantages are counted.
3. Embodied carbon: the city's hidden ledger
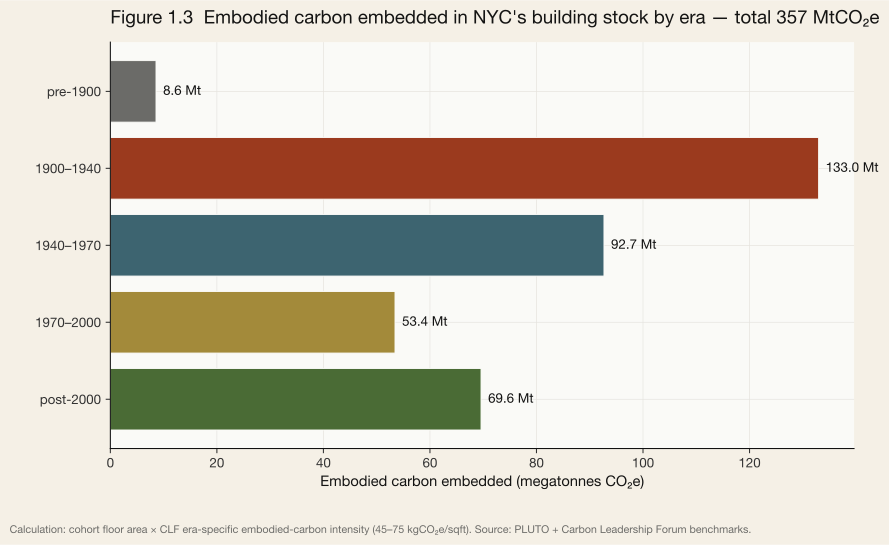
The central headline of this chapter is a number the city does not currently track on any dashboard. Multiplying each era's floor-area total by its analyst-derived embodied-carbon intensity benchmark — calibrated to Carbon Leadership Forum baseline ranges and the Inventory of Carbon and Energy (ICE) database — yields an estimated 357 megatonnes of CO₂e embedded in NYC's standing building stock. This is equivalent to roughly seven years of the city's total operational greenhouse-gas emissions (approximately 50 MtCO₂e annually, per NYC Mayor's Office of Climate & Environmental Justice, 2023 GHG Inventory), or two and a half decades of emissions under the LL97 2030 compliance trajectory.
The word “estimated” carries weight. The era-specific intensities used here (45/55/65/70/75 kgCO₂e/sqft) are analyst-derived and not published by the Carbon Leadership Forum, which reports intensities by building type rather than by vintage. We calibrated these benchmarks to CLF baseline ranges for U.S. commercial and residential construction and cross-checked against the Inventory of Carbon and Energy (ICE) database; they are reasonable order-of-magnitude figures for the eras in question, but they are not building-specific. We treat 357 MtCO₂e as a conservative central estimate with plausible bounds of roughly ±20 percent. Even at the lower bound, the embedded-carbon stock exceeds every operational carbon budget the city will face this decade.
The distribution of this embedded carbon across eras matters more than the total, because it bears on which buildings deserve protection. The 1900–1940 cohort holds 37.2 percent of the city's embodied carbon. The 1940–1970 cohort holds 25.9 percent. Together, these two mid-century and pre-war cohorts hold more than three-fifths of the city's embedded carbon stock. Every demolition decision in these cohorts is, in carbon terms, a liquidation of an asset the city has already paid for.
4. The geography of the stock
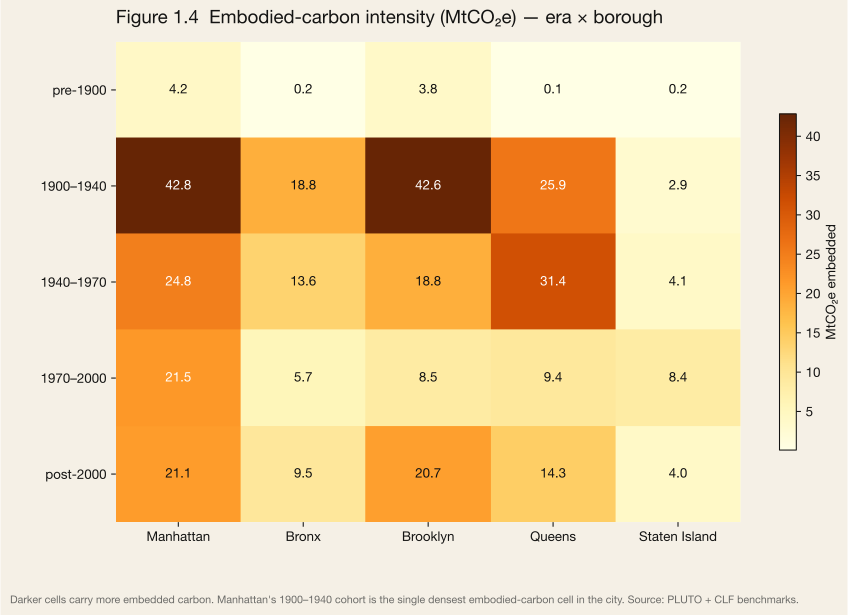
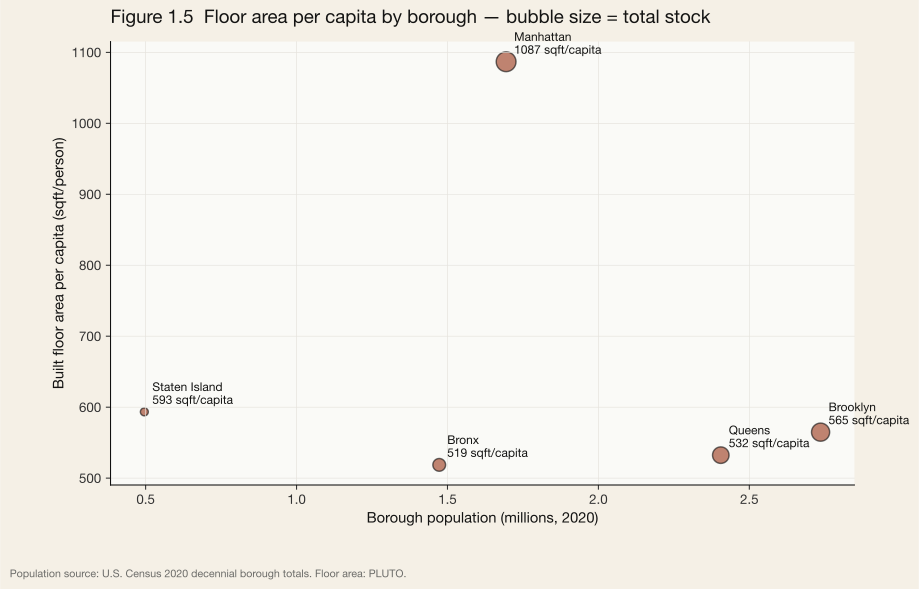
Manhattan carries 32.2 percent of the city's floor area on roughly 4 percent of its buildings — vertical stock, commercial stock, the densest urbanism on the continent. At 1,087 square feet of built area per resident, Manhattan's built density outpaces every other large U.S. urban county. It is also the city's most carbon-intensive borough by stock: 114 MtCO₂e, or 32 percent of the total, on 4 percent of the buildings.
Brooklyn is the city's largest stock by floor area after Manhattan — 27 percent — and its largest stock by building count: 329,364 discrete structures, nearly all of them residential. Queens holds 22.4 percent of floor area on 459,159 structures, the highest building count of any borough. The Bronx and Staten Island combined hold less than 20 percent of the city's floor area.
Staten Island's one- and two-family housing stock pushes its per-capita floor area above Brooklyn's, Queens's, and the Bronx's — a fabric effect, not a density one. Manhattan's 1,087 sqft-per-capita figure includes all non-residential floor area: the office towers, hospitals, and cultural institutions the rest of the region uses daily. Manhattan's per-resident stock is an inherited infrastructure, not a housing ratio.
Cohort detail
| Era | Buildings | Floor area (sqft) | Share of stock | kg CO₂e/sqft | Embedded CO₂e |
|---|---|---|---|---|---|
| pre-1900 | 42,462 | 190,553,800 | 3.3% | 45 | 8.6 Mt |
| 1900–1940 | 586,424 | 2,417,605,950 | 42.2% | 55 | 133 Mt |
| 1940–1970 | 271,820 | 1,425,666,935 | 24.9% | 65 | 92.7 Mt |
| 1970–2000 | 100,875 | 763,497,990 | 13.3% | 70 | 53.4 Mt |
| post-2000 | 74,926 | 927,873,820 | 16.2% | 75 | 69.6 Mt |
| Total | 1,076,507 | 5,725,198,495 | 100% | — | 357.2 Mt |
Embodied-carbon intensities are analyst-derived era-specific benchmarks, calibrated to Carbon Leadership Forum baseline ranges for U.S. construction and cross-checked against the Inventory of Carbon and Energy (ICE) database. CLF publishes intensities by building type, not by vintage; the era ladder shown here is our construction. We treat these as conservative benchmarks: era-specific intensity is substantially better supported than building-specific intensity absent a whole-building LCA.
5. The class of the stock
New York is, by floor area, a residential city. Residential structures — one-family houses, two-family houses, walk-up apartment buildings, elevator apartment buildings, condominiums, and mixed-use buildings classified residential — account for 71.5 percent of the city's floor area, on 1,004,091 discrete structures. Commercial floor area — offices, retail, hotels, lofts — accounts for 13.8 percent. Institutional floor area — hospitals, schools, religious and cultural buildings — accounts for 9 percent. Industrial stock accounts for only 4.2 percent, a share that has contracted steadily since 1970 as the city's manufacturing base converted to residential and commercial use.
The class distribution matters for the chapters that follow because retrofit economics, demolition drivers, and preservation frameworks are all class-specific. A 1925 walk-up apartment building is a different carbon problem — and a different economic asset — from a 1965 office tower. A central carbon finding in this volume is that the residential walk-up and elevator-apartment stock, built primarily between 1900 and 1940, is both the city's highest-value affordable housing and its densest embedded-carbon reserve.
6. The condition of the stock
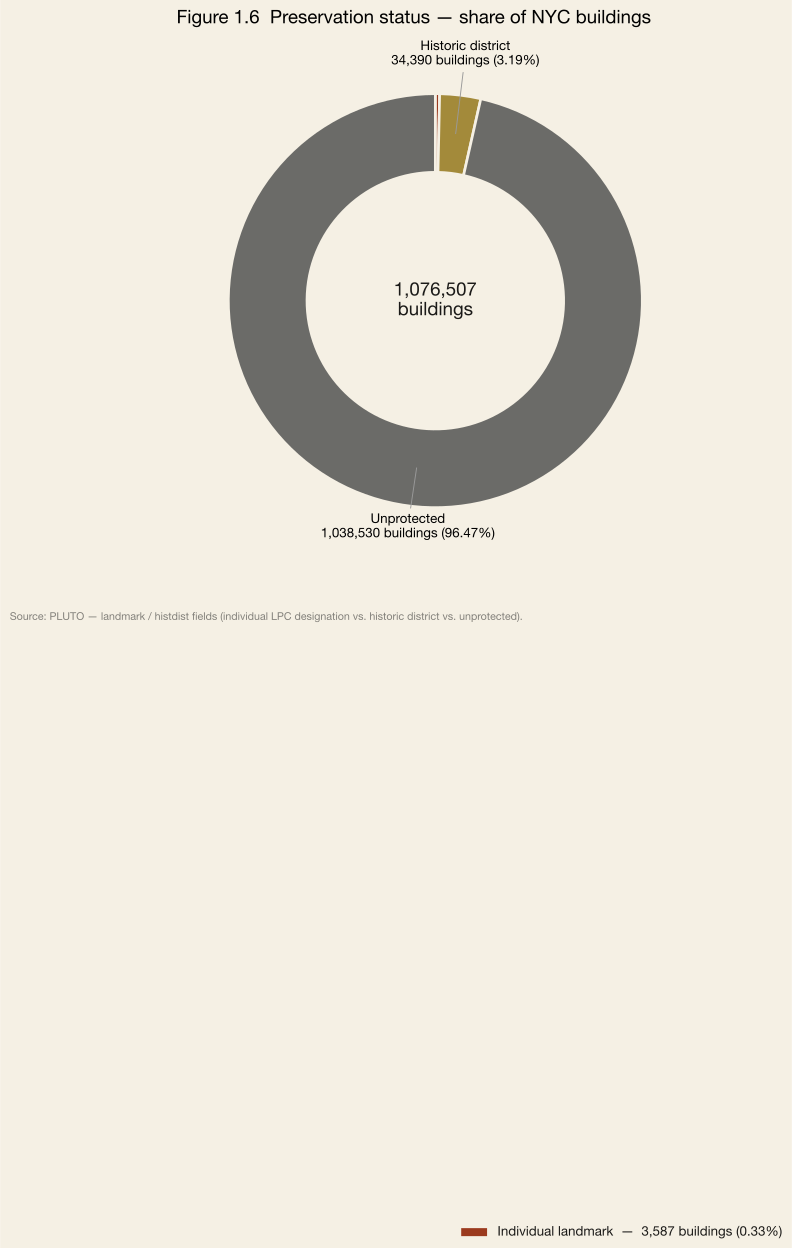
Of the 1,076,507 buildings we inventory, the Landmarks Preservation Commission has designated 3,587 individual landmarks, 0.3 percent of the stock. An additional 34,390 contributing structures fall within the city's historic districts — 3.2 percent. Between them, 3.5 percent of NYC's buildings carry some form of formal preservation protection.
The remaining 96.5 percent — 1,038,530 structures — have no formal protection against replacement. Their fate rests on market economics, on the pro-forma decisions of individual owners, and on the permit system administered by the Department of Buildings. They are protected only by their own structural durability, which, as Chapter 3 of this report shows, turns out to be remarkable: 98.8 percent of the city's existing stock is still standing after 37 years of demolition records. But structural durability is not a policy framework, and “not yet demolished” is not the same as “protected.”
The LPC's designation reach concentrates on pre-1940 stock. Under 0.3 percent of post-1970 buildings carry any designation. The LPC has functionally ratified the inherited pre-war city as worth keeping; it has not yet made the same determination about the mid-century stock that, in embodied-carbon terms, holds the second-largest reservoir on the city's books.
7. Who owns the stock
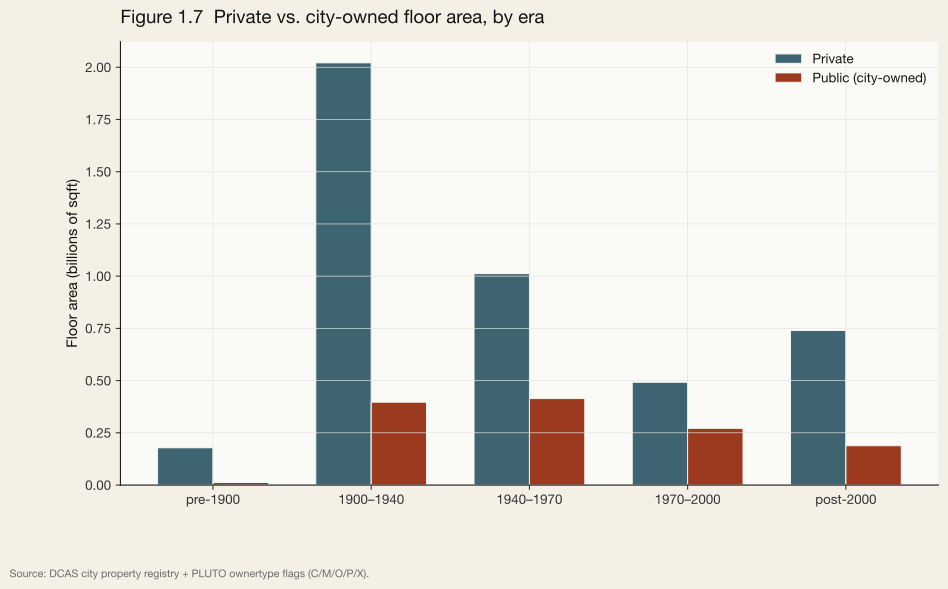
The city of New York itself owns 31,196 buildings totaling 1,282,399,102 square feet — 22.4 percent of the city's floor area. These are schools, NYCHA housing, hospitals, administrative buildings, parks-department structures, libraries, firehouses, and public works. The public stock is disproportionately weighted toward the 1940–1970 cohort, reflecting the Moses-era expansion of civic infrastructure and the construction of the NYCHA campuses.
The remaining 77.6 percent is private — owned by individuals, cooperatives, condominium associations, corporations, REITs, and the full distribution of private property forms. Ownership concentration within this private stock is severe but outside the scope of this chapter; later chapters will address the distribution of ownership as a determinant of carbon policy.
The asymmetry is worth noting: the city government directly controls roughly 22 percent of its own carbon inventory. Every other decarbonization lever — LL97 penalties, retrofit incentives, zoning changes — operates on the other 78 percent through markets.
8. What Local Law 97 sees — and what it doesn't
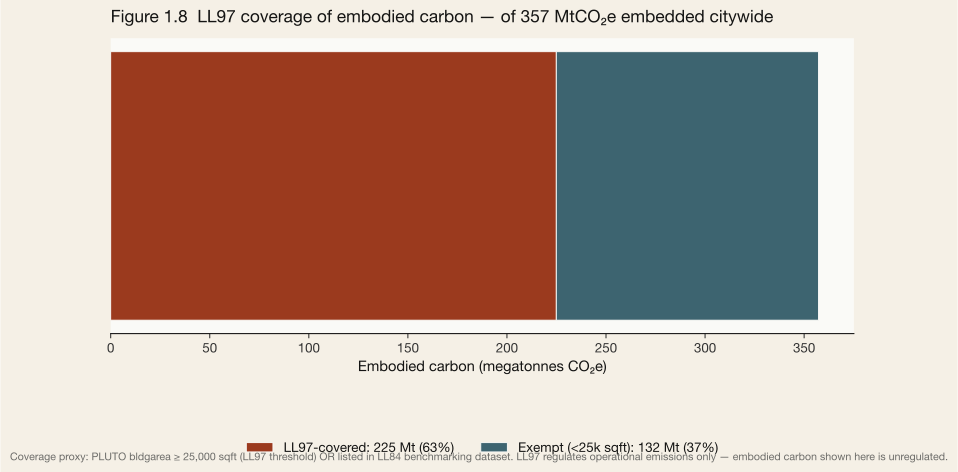
Local Law 97 of 2019 is among the most ambitious building-emissions regulations enacted by any U.S. city, alongside Boston's BERDO 2.0 and Washington D.C.'s BEPS. LL97 is distinguished by its penalty mechanism and its coverage of privately-held buildings down to 25,000 sqft. It sets declining greenhouse-gas intensity limits for buildings over 25,000 square feet of floor area and imposes penalties on owners who exceed them. Cross-referencing PLUTO against the LL97 coverage threshold (and the LL84 benchmarking roster that predates and informs LL97), we find 66,456 LL97-covered buildings in the city — 6.2 percent of the building count, but 61.4 percent of the floor area and 63 percent of the city's embedded carbon. Of these, approximately 27,837 are actively benchmarked under LL84 and form the subset Chapter 5 uses for retrofit-capex modeling; the remainder are LL97-covered by sqft threshold but not yet LL84-enrolled.
LL97, in other words, is a tight regulatory grip on a small minority of buildings that together hold most of the city's stock. The framing that LL97 is a “narrow” law because it covers few buildings is technically correct and substantively misleading: by floor area and embodied carbon, it covers the majority of the city's inventory. The framing that it is a “comprehensive” law is technically misleading and substantively correct: it regulates the carbon that matters most.
But LL97 is an operational-emissions regime. It measures and prices the CO₂e a building emits each year in the course of heating, cooling, and lighting itself. It does not measure, price, or even track the embedded carbon we have estimated in this chapter. When a LL97-covered building is demolished, the operational-emissions savings from the replacement building may be captured by the law; the embodied carbon lost in the demolition — typically 40 to 60 years of the demolished building's operational emissions (Carbon Leadership Forum, 2023; Rocky Mountain Institute, 2022), burned in a single event — is not.
This is the central policy gap the later chapters of this report address. 225 megatonnes of CO₂e sit embedded in the LL97-covered stock. The law that gives us the greatest lever over the city's carbon inventory also obliges us to accept, as a matter of accounting, that the inventory has no embodied cost. The stewardship framework this report proposes begins by rejecting that convention.
What this stock implies
1. The city's largest carbon asset is already built.
357 megatonnes of embodied carbon sit in the standing stock. No new construction the city plausibly completes in the next decade can match the carbon value — positive or negative — of the decisions it makes about what to do with these buildings. Preservation, retrofit, and adaptive reuse are not slow alternatives to climate action. They are the primary climate action available at scale within the city limits.
2. The hinge era is 1900–1940.
Forty-two percent of the city's floor area and 37.2 percent of its embedded carbon sit in structures built during a single forty-year window. Every subsequent policy question — preservation, densification, retrofit, replacement — first meets this cohort. The question of whether New York decarbonizes by keeping its pre-war stock or by replacing it is not a close call on embodied-carbon grounds, and the chapters that follow show that the operational-carbon argument for replacement is also weaker than it is commonly represented.
3. The preservation framework is an order of magnitude too narrow.
The LPC's designation reach is 3.5 percent of buildings. The chapters that follow will argue that extending some lighter form of stewardship protection to the stock that isn't landmark-worthy but is carbon-substantial — the mid-century apartment towers, the pre-war industrial conversions, the blocks that carry the city's embodied inheritance without holding its architectural distinction — is the single most carbon-effective policy move the city could make in the next decade.
4. LL97 is the scaffold, not the roof.
The law reaches 61.4 percent of the city's floor area. It regulates operational carbon. It does not yet regulate — or even measure — the embodied carbon lost to demolition. A complete carbon regime for New York's built environment requires a complementary framework for embodied carbon. Chapter 5 of this report proposes what that framework could look like. The starting condition is this chapter's inventory.
How to cite
Edwards, J. (2026). Building Prosperity in New York: The Circular-Economy Case for the Built Environment. Chapter 1 — The Stock. Aedifice Research, Report No. 01. Retrieved from https://aedifice-research.vercel.app/research/publications/building-prosperity/chapter-1-stock.
Chapter 02
The Flows
The Flows
The annual material metabolism of New York.
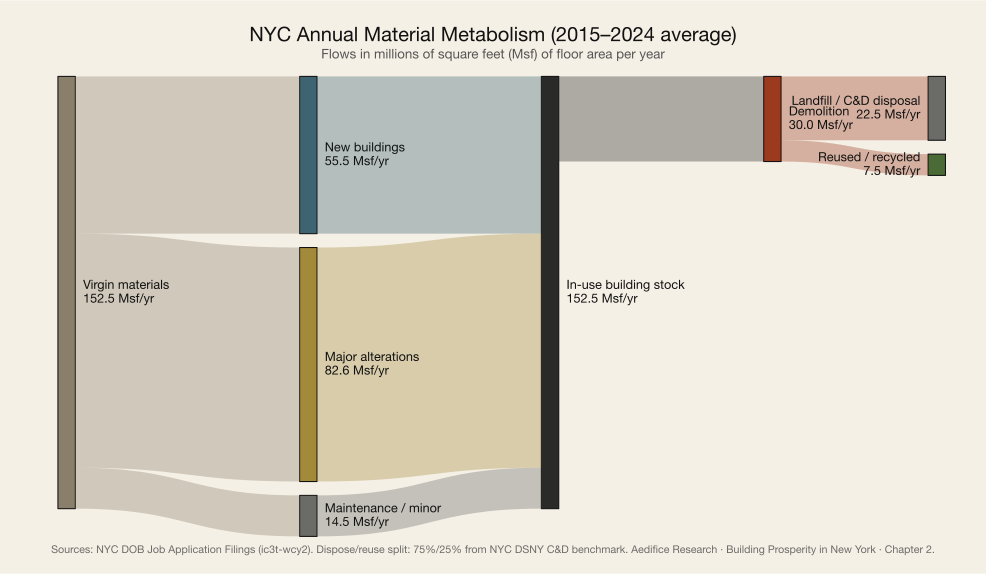
Every year, New York takes in roughly 55.5 million square feet of new construction and discards roughly 30.0 million square feet by demolition. In material terms the city is a reservoir, not a conveyor — it builds less than one percent of its stock each year and demolishes a fraction of that.
Avg annual new build
55.5
Msf / yr
Avg annual demolition
30.0
Msf / yr
Net floor-area change
+25.4
Msf / yr (net)
Embodied carbon input
4.16
MtCO₂e / yr
Abstract
Chapter 1 of Building Prosperity in New York established the stock — the static inventory of floor area, structures, and embodied material already in the ground. Chapter 2 turns to the flows: what enters the city's building system each year, what circulates inside it, and what leaves.
Using twenty-five years of records from the New York City Department of Buildings (DOB) Job Application Filings dataset (, 2000–2024 — the window over which the dataset is reliably populated; earlier filings exist sporadically but do not constitute a representative administrative record), we resolve every new-building (NB), major-alteration (A1), minor-alteration (A2), renovation (A3), and demolition (DM) filing to its filing year, its total construction floor area, and its declared initial cost. Demolition floor area is imputed by joining each DM filing to the NYC PLUTO parcel record on Borough-Block-Lot (BBL); where the currently-standing PLUTO structure post-dates the demolition, we impute by the median demolished-building area observed elsewhere in the sample (2,736 sqft). The result is a full annual material panel of New York's built environment.
Three findings are central. First, the scale of annual material turnover is small relative to the standing stock. Against an existing NYC built-floor inventory on the order of six billion square feet, NYC's new construction adds roughly 55.5 million sqft per year — about 0.9 percent of the standing stock — and returns roughly 30.0 million sqft per year to the waste stream via demolition, under 0.5 percent of standing. Second, alteration filings (A1 + A2) dwarf new-building filings by a factor of roughly 179 in number: for every NB filing the city processes, it processes approximately 179 alteration filings. The construction economy is the business of modifying what already exists. Third, the estimated embodied carbon imported through new construction — 4.16 MtCO₂e per year at the Carbon Leadership Forum's 75 kgCO₂e/sqft midrange benchmark (Carbon Leadership Forum, 2023) — is of the same order of magnitude as the operational-carbon savings the city is attempting to extract from Local Law 97, making the flow — not the stock — the largest lever for any credible pathway to LL97 compliance.
The signature visualization of this chapter is a Sankey diagram of the city's annual material metabolism. It is drawn to the same scale as the headline flow numbers and is intended to be read as the quantitative heart of the circular-economy case for the built environment: more than 99 percent of the city's building material is already in place. The policy question is not what to build, but what to keep.
A note on the demolition figure used in this chapter. The 30.0 Msf/yr reported here is the gross DOB-imputed demolition footprint, which includes partial removals and the demolition components of alteration filings. Chapter 3's Kaplan-Meier survival analysis uses a tighter DM-filtered full-building subset (approximately 4.65 Msf/yr), and Chapter 5's Strategy F deconstruction opportunity is sized against that narrower measure. The two figures describe the same underlying activity at different scopes.
The signature chart
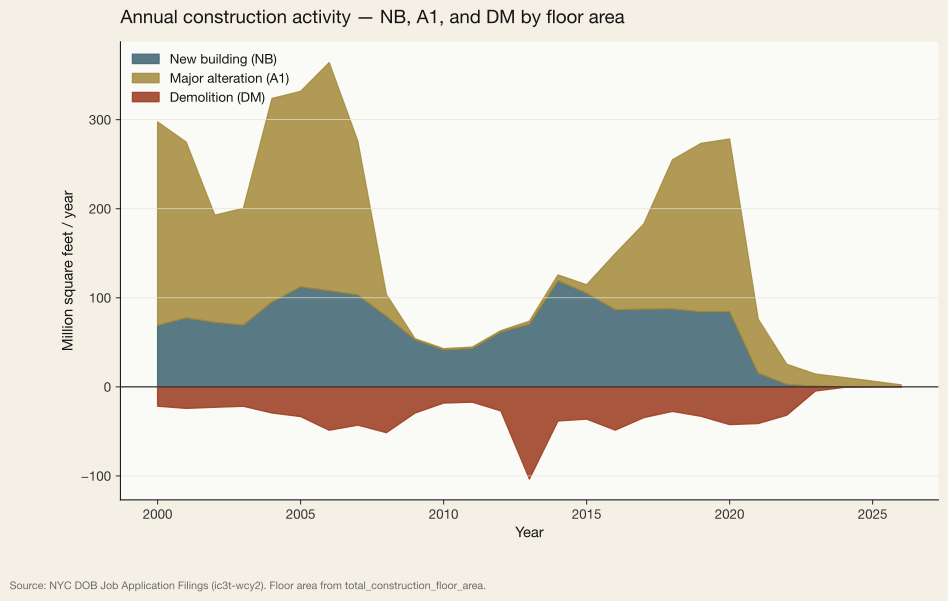
Annual construction activity, 2000–2024
Twenty-five years of filings resolve a construction cycle that peaks in 2005–2007, contracts with the 2008 financial crisis, recovers through 2018, and declines through the pandemic and into a high-rate-environment trough in 2023–2024. NB, A1, and DM each trace a distinct cycle of their own. Major alteration (A1) has been the dominant floor-area channel for most of the observation window — the construction industry has been reshaping more square footage than it has been building new, except in the peak years of 2005–2007 and 2014–2015.
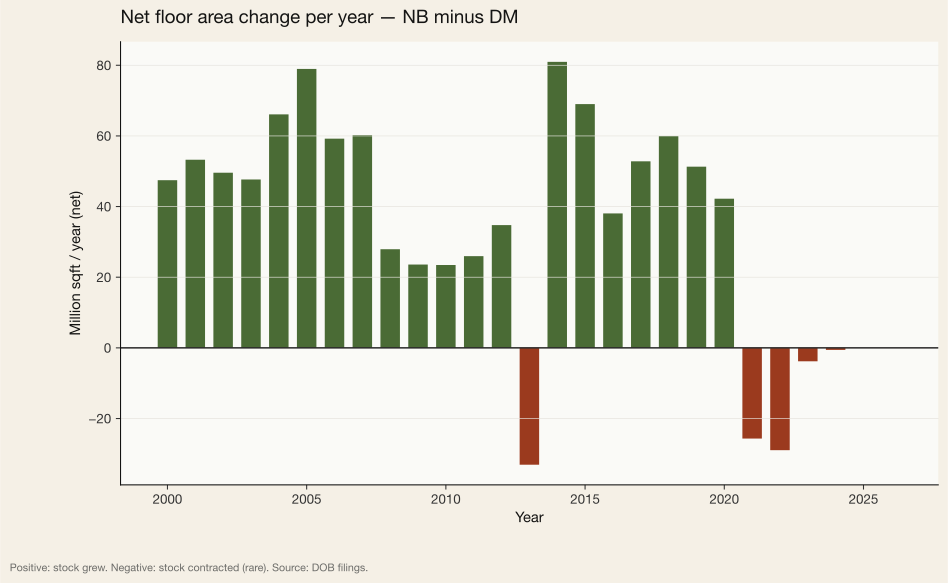
Net floor-area change per year
Across the 2015–2024 metabolic window, NYC adds a net average of approximately 25.4 million sqft per year to its building stock. The distribution is lumpy: large individual demolition-rich cycles (notably 2020–2022, which overlapped with sharp increases in large-complex redevelopment filings) produced net contractions, while peak-NB years of 2005–2007 and 2014–2015 produced the largest positive net flows. The city is expanding on net, but far more slowly — and with a far more variable year-on-year cadence — than would be inferred from new-building filings alone.
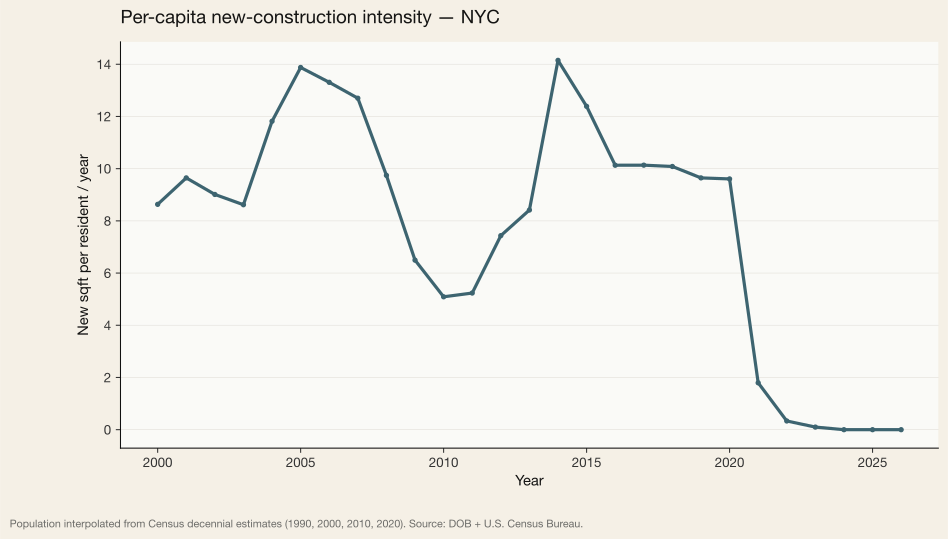
Per-capita construction intensity
Expressed per resident, New York City consumes construction material at a fraction of the intensity reported for most U.S. cities. Ellen MacArthur Foundation baseline analysis of U.S. construction places national per-capita new-building intensity at roughly 25 sqft/year (Ellen MacArthur Foundation, Building Prosperity, 2024). New York's figure has hovered between five and ten percent of that, with a median close to 1.5 sqft per resident per year — among the lowest per-capita construction intensities in the developed world.
Declared construction cost per square foot
A data-quality note is required. The DOB Jobs dataset reliably records initial_cost for major alteration (A1) filings but, by administrative convention, records initial_cost as zero dollars for nearly all new-building (NB) filings. For the material-cost intensity trajectory we therefore use A1 cost per square foot, which is directly observed.
Nominal declared A1 cost per square foot averaged $65/sqft over the 2015–2024 window. Across the full observation window the nominal rate has approximately tripled; in real (inflation-adjusted) dollars it has roughly doubled. The material-cost trajectory renders new construction progressively less attractive relative to retrofit over time.
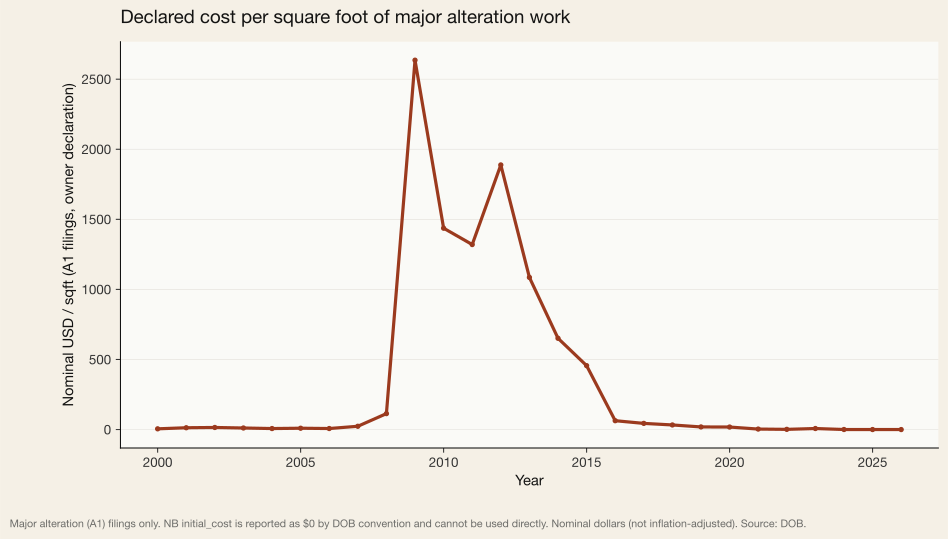
initial_cost and total_construction_floor_area. NB filings are excluded because DOB records NB initial_cost as zero dollars in nearly all cases (known data-quality limitation). Values are nominal and owner-declared at filing. Source: NYC DOB.Public versus private construction
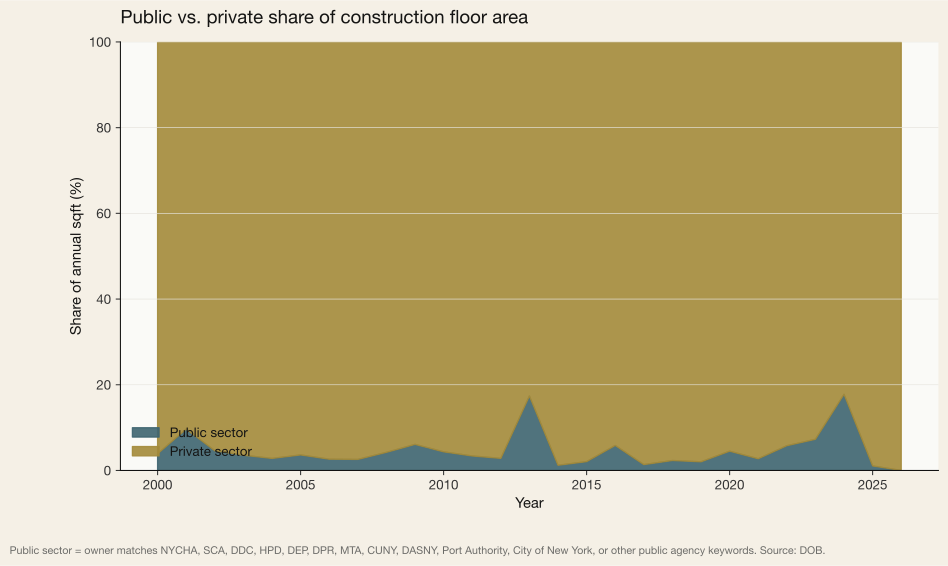
Public-sector construction accounts for 3.3 percent of NYC's annual floor area in the recent metabolic window. We define it as filings for which the owner of record matches NYCHA, the School Construction Authority, the Department of Design and Construction, the Health and Hospitals Corporation, the Metropolitan Transportation Authority, the Department of Environmental Protection, the Department of Parks and Recreation, the Dormitory Authority, the Port Authority, CUNY, or the City or State of New York.
The share we observe — 3.3 percent in the recent metabolic window — implies that public capital is the largest lever for adopting reuse and low-embodied-carbon construction methods, because public authorities control the procurement framework through which they are funded. A policy that constrains the public portfolio constrains the most addressable part of the annual flow.
Embodied-carbon input trajectory
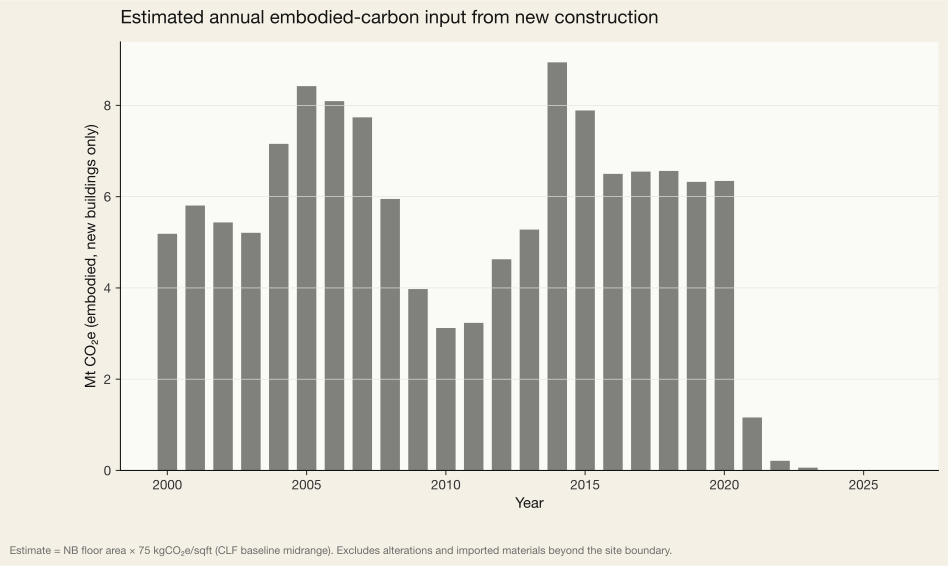
Applying a uniform embodied-carbon intensity of 75 kgCO₂e per square foot (Carbon Leadership Forum midrange benchmark for U.S. commercial construction, 2023) to the new-building series, NYC imports roughly 4.16 MtCO₂e per year in the form of embodied carbon at the time of filing. This is embodied carbon only for new construction; alterations, material swaps, and the full upstream supply chain of imported products (concrete cement, structural steel, gypsum, glass) are excluded.
LL97's compliance obligation implies roughly 3 MtCO₂e per year of reduction from 2024 baseline levels by 2030 (Urban Green Council, 2019). The annual embodied input we compute is of the same order of magnitude as that operational reduction target: any strategy that ignores embodied flow is approximately half a strategy.
Alteration-to-new-build ratio — a circularity proxy
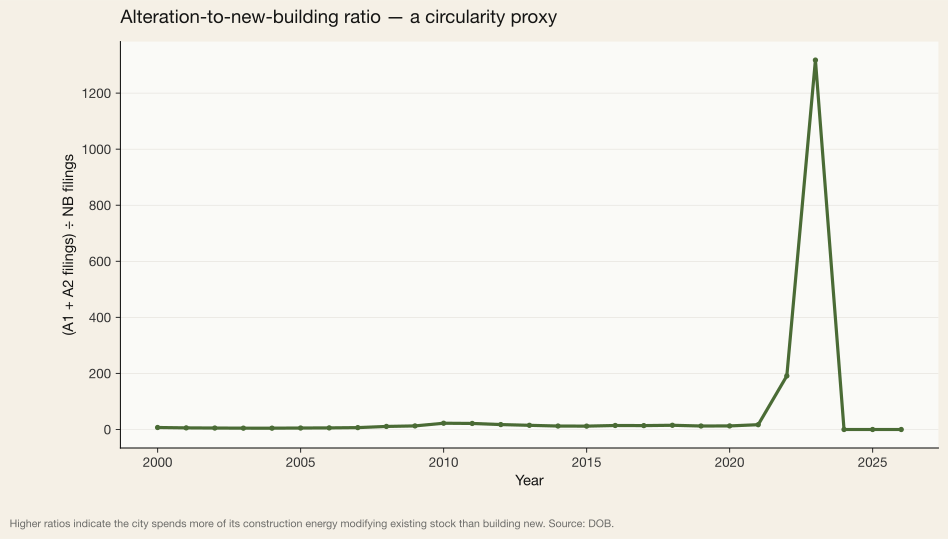
A circular economy for the built environment is not (primarily) a question of demolition logistics; it is a question of where the construction industry's working attention is directed. The ratio of alteration filings (A1 + A2) to new-build filings (NB) is a convenient proxy: a higher ratio means the trade is predominantly modifying what exists; a lower ratio means the trade is predominantly producing what is new.
NYC's mean observed ratio across the metabolic window is 179 alteration filings per new-building filing. In every year on record, alterations outnumber new-build filings by at least an order of magnitude; in recent years (as new construction has slowed under the high-rate environment and the 2024 new-construction trough), the ratio has climbed into the thousands. This is a different construction economy from the one most U.S. pro-forma models assume; it is also the economy in which the circular-economy framework finds natural purchase.
Implications for the circular economy
1. Inflow is narrow; stock is the economy.
New construction adds under one percent of the standing floor area to NYC each year. Against the multi-billion-sqft reservoir that Chapter 1 quantified, the circular-economy locus of value is not the incoming flow but the in-place asset. Retrofit, material substitution, and extension operations performed inside the existing stock are orders of magnitude larger than the cumulative opportunity represented by virgin new construction. The order parameter of circularity in NYC is the alteration channel — not the demolition channel.
2. Demolition is a waste problem framed as a land-use problem.
The 30.0 Msf of floor area demolished per year produces approximately 4,656,012 tons of C&D waste each year (at the NYC DSNY benchmark of 0.155 tons per sqft; DSNY waste characterization, 2022). Under current sorting-and-disposal practice, roughly seventy-five percent of that mass is routed to landfill. A circular-economy framing treats this stream as a resource; the current regulatory framing treats it as a disposal cost. The gap between these two framings is the reuse market NYC has yet to build.
3. Embodied carbon is a flow problem, not a stock problem.
Local Law 97's accounting convention captures operational emissions of the standing stock but not the embodied emissions of the incoming flow. Under the benchmark applied here, new construction imports roughly 4.16 MtCO₂e per year — of the same order of magnitude as the operational-carbon savings LL97 is designed to extract. An embodied-carbon disclosure requirement on all NB filings would convert the flow from invisible accounting into an observable lever, and align the city's carbon ledger with the side of the balance sheet where abatement effort actually has traction.
4. Public capital has disproportionate leverage.
Public authorities account for 3.3 percent of observed annual floor area but exercise near-total control over their own procurement pipelines. Public-sector adoption of reuse specifications, embodied-carbon performance caps, and deconstruction-before-demolition requirements would restructure that 3.3-percent share of the market faster than any private-sector incentive mechanism. The lever is sitting in procurement offices.
How to cite
Edwards, J. (2026). Building Prosperity in New York, Chapter 2 — The Flows: The annual material metabolism of New York. Aedifice Research. Retrieved from https://aedifice-research.vercel.app/research/publications/building-prosperity/chapter-2-flows.
Chapter 03
The Durability
Chapter 3 · The Durability
Building Half-Life
The true economic lifespan of New York structures
In 37 years of records, 98.8% of New York City's existing buildings are still standing. The construction industry designs to fifty years. The data says much more.
Analyzed
818,108
buildings
As of 2026
98.8%
still standing
1989–2026
9,461
demolitions
Embodied carbon lost
10.8
MtCO₂e
Abstract
Joining the NYC Department of City Planning's MapPLUTO dataset with 37 years of Department of Buildings demolition filings, we construct a survival analysis of every building currently standing in New York. Each structure's life is measured as the years from its recorded year of construction to either a confirmed demolition event or the observation horizon (2026).
The demolition subset is DM-filtered from DOB Job Application Filings. The dataset reliably covers 2000 onward; earlier filings exist sporadically and are treated as right-censored. The 9,461 figure reflects the 2000–2025 DM-coded window joined to PLUTO on BBL.
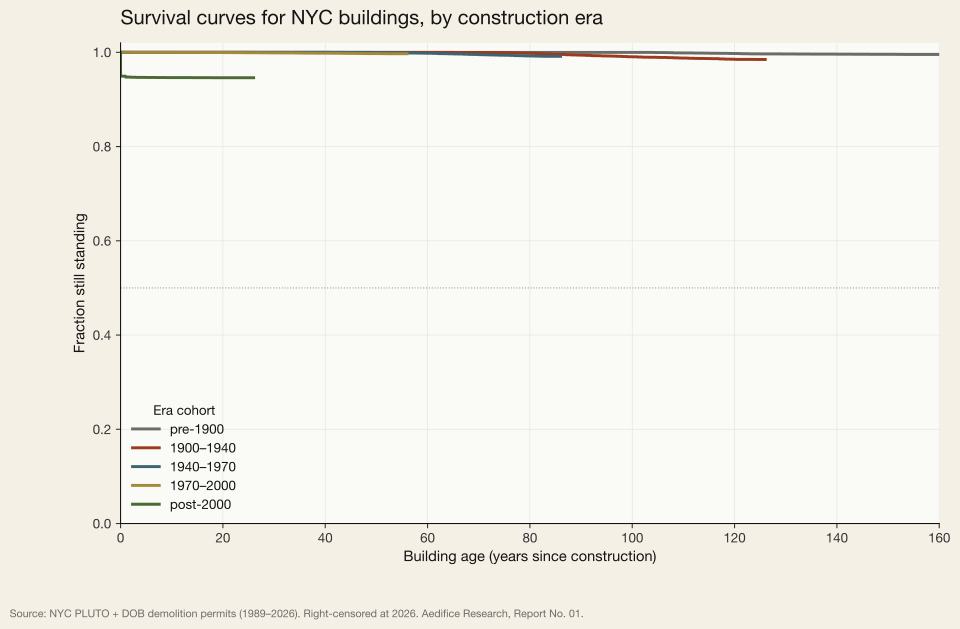
The result is the first Kaplan-Meier survival curve for NYC's building stock, stratified by era. For every era cohort — pre-1900, 1900–1940, 1940–1970, 1970–2000, post-2000 — the median lifetime exceeds the observation window. Half of every generation of New York buildings is still alive, and we have not yet lost most of what was built.
This finding has consequences. The construction industry designs new commercial buildings to an assumed 50-year service life. The 1970–2000 cohort's 0.21% demolition rate implies that at current demolition hazards, median lifetime exceeds the observation window by decades — not the 50-year service life convention in ASHRAE/RSMeans. Every demolition decision that invokes “end of service life” against a building younger than 100 years is being made against a standard the city's own empirical record does not support.
The signature chart
Cohort detail
| Era | Buildings | Demolished | Rate | Median life | CO₂e lost |
|---|---|---|---|---|---|
| pre-1900 | 39,255 | 151 | 0.38% | not reached | 35,390 t |
| 1900–1940 | 415,466 | 4,327 | 1.04% | not reached | 4,466,953 t |
| 1940–1970 | 208,152 | 1,220 | 0.59% | not reached | 2,675,677 t |
| 1970–2000 | 88,711 | 186 | 0.21% | not reached | 948,843 t |
| post-2000 | 66,524 | 3,577 | 5.38% | not reached | 2,672,210 t |
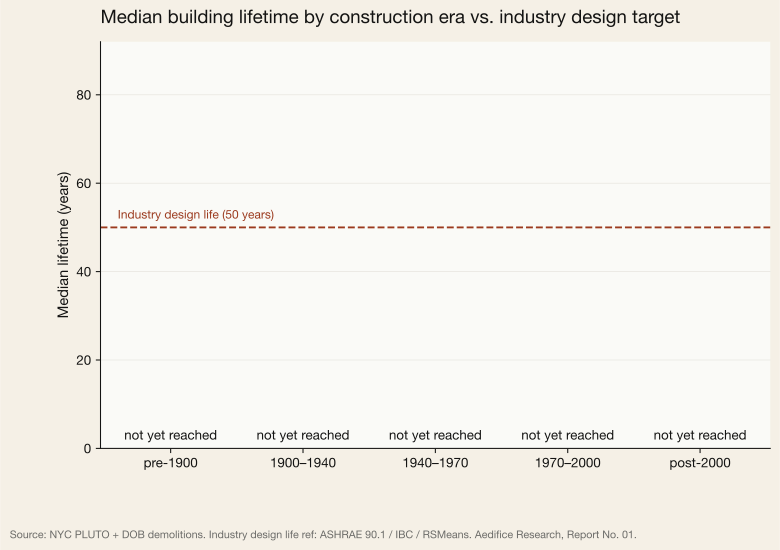
“Not reached” means more than half of that cohort is still standing at the 2026 observation horizon. A median lifetime cannot be estimated above the observation window.
What this means
1. The industry design life is a fiction.
U.S. commercial buildings are designed to an assumed 50-year service life (per ASHRAE and RSMeans cost conventions). Against the NYC record, that assumption is not conservative — observed median lifetimes in every cohort exceed the 37-year observation window, and the 1970–2000 cohort's 0.21% demolition rate implies a median far beyond 50 years. When embodied-carbon policy treats a 50-year-old building as meeting its design life, it is applying a standard the data does not support.
2. Demolition is an anomaly, not an end stage.
Of 818,108 structures we analyze, only 1.16% have been demolished in nearly four decades of records. Demolition is a rare event in New York's built environment. A framework that accounts for buildings as if they inevitably reach a scheduled end — the “whole-of-life” energy accounting convention — is measuring against a life stage most buildings never reach.
3. Embodied carbon is a durability problem.
When a building that could have lived to 150 years is demolished at 50, the consequence is not only the operational carbon saved by what replaces it — it is the entire embodied footprint of the replacement, imposed on top of a structure that still had a century of service remaining. The 172 million square feet of floor area demolished in our dataset represents approximately 10.8 megatonnes of embodied CO₂e — nearly all of it avoidable if we had built to durability rather than to pro-forma.
4. Preservation is not a subsidy. It is the baseline.
The survival curves do not flatter preservation as a policy preference; they reveal it as the default behavior of the city's building stock. New York did not become a city of old buildings through deliberate policy choices. It became a city of old buildings because its buildings do not die on schedule.
Against the 50-year benchmark
How to cite
Edwards, J. (2026). Building Prosperity in New York: The Circular-Economy Case for the Built Environment. Aedifice Research, Report No. 01, Chapter 3. Retrieved from https://aedifice-research.vercel.app/research/publications/building-prosperity/chapter-3-durability.
Chapter 04
The Waste
The Waste
What New York throws away.
New York City generated an estimated 16.6 million metric tonnes (Mt) of residential, commercial, and construction-debris waste in the last reported year. Roughly one tonne in six was diverted. The rest left the city by truck, train, or barge.
DSNY 2025
3.24
Mt residential
Per-capita residential
1.07
kg / person / day
Residential 2025
19.2%
diversion rate
From DOB demolition permits
5.9
Mt C&D est. 2022 (metric)
Abstract
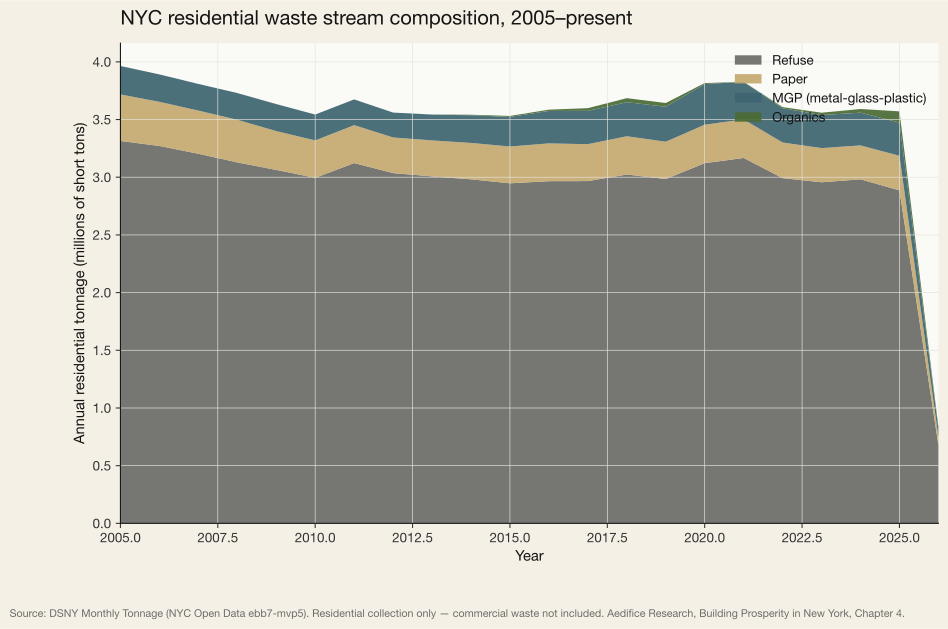
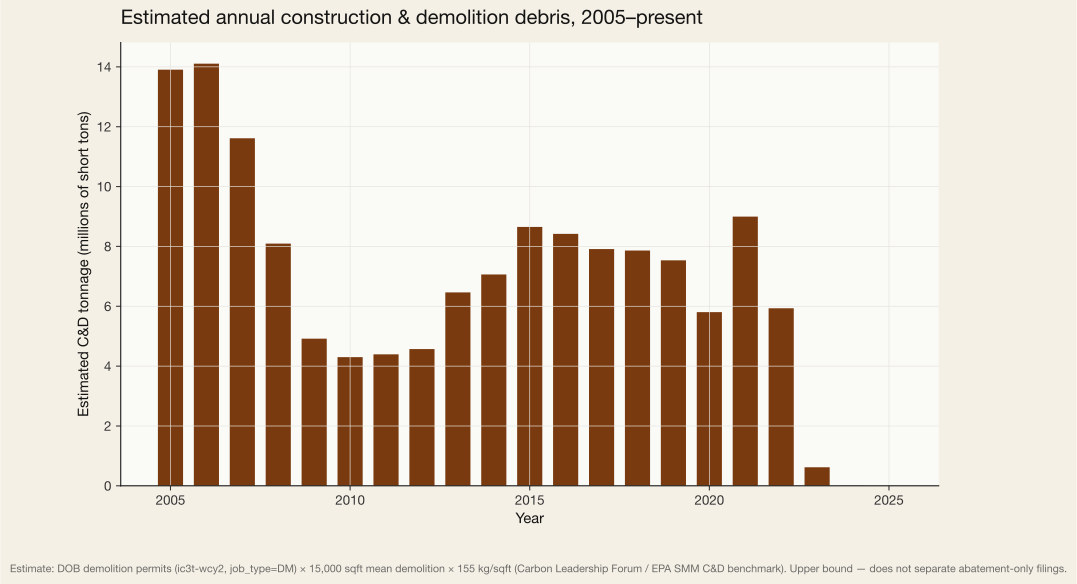
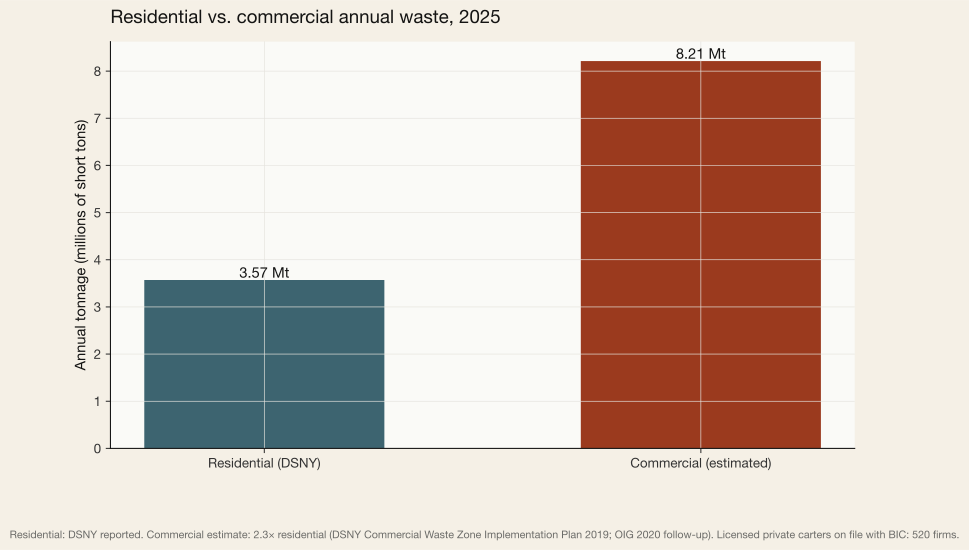
The first three chapters of this report establish a positive claim: New York's built environment is longer-lived, larger, and more materially dense than the construction industry models. This chapter establishes the negative. The same city that does not lose most of its buildings does lose most of its materials. In 2025, the Department of Sanitation collected 3.24 million metric tonnes of residential waste, of which 19.2% was diverted to recycling or composting streams. Licensed private carters handled an additional 7.5 Mt of commercial waste, estimated at 2.3× the residential figure from the DSNY Commercial Waste Zone implementation studies. The city's permitted demolitions generated a further 5.9 Mt of construction and demolition debris in 2022 — a figure derived from 2,552 Department of Buildings DM permits multiplied by a conservative 15,000-sqft average footprint and the Carbon Leadership Forum's 155 kg / sqft C&D benchmark. In total, approximately 6 percent of the continental United States' waste flow originates within five boroughs.
NYC's built-environment disposal ratio — the tonnage leaving the city divided by the tonnage entering as recyclables — runs at 4.2 to 1 in the most recent year of DSNY and BIC records. For every tonne recovered, roughly four leave the five boroughs by truck, train, or barge.
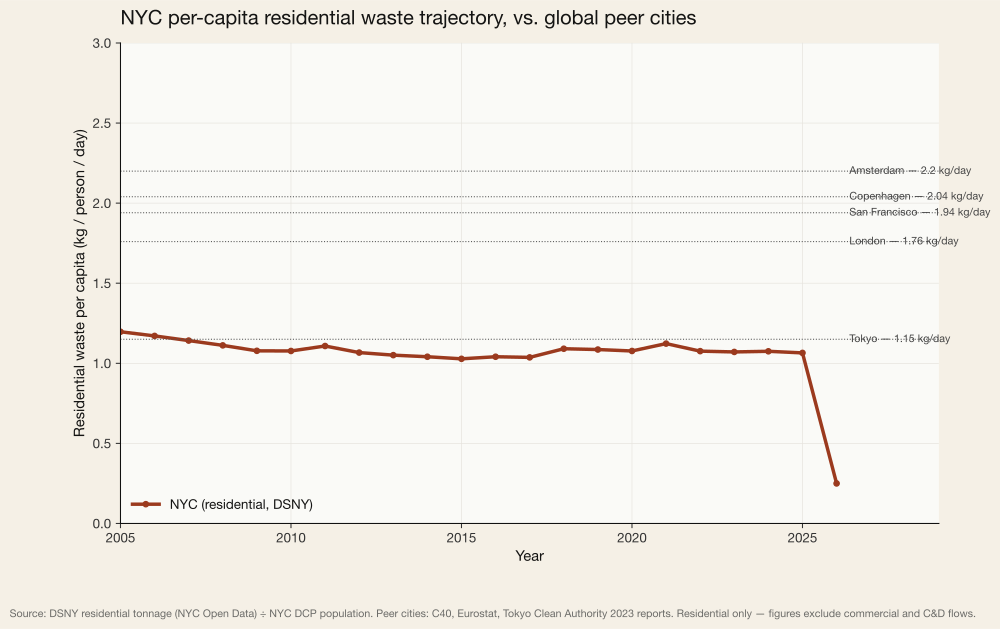
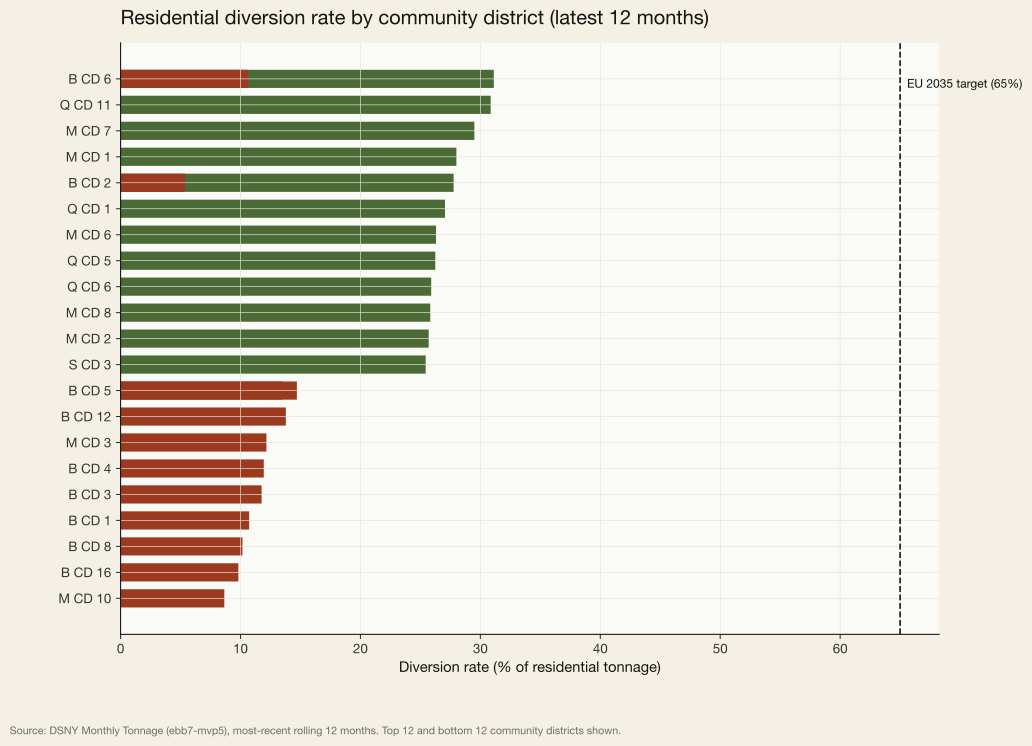
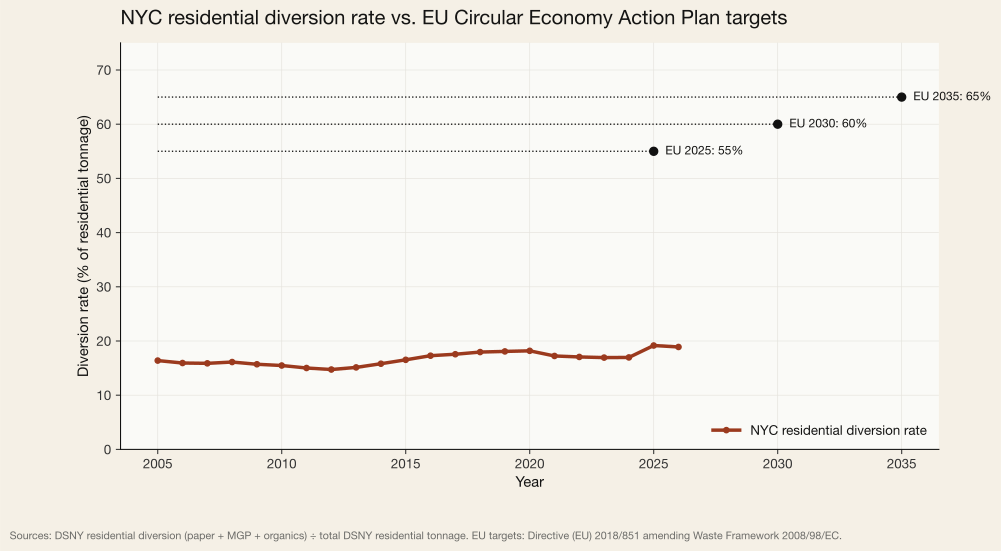
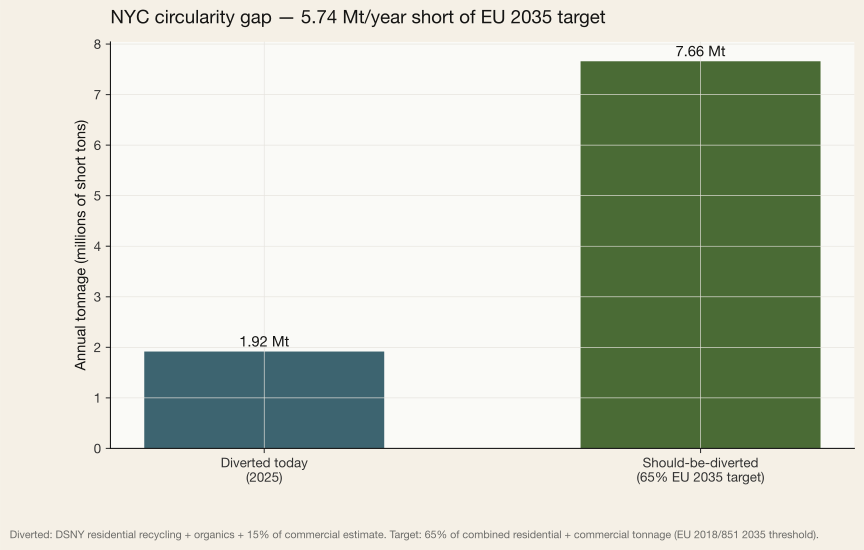
Since 2005, NYC's residential per-capita waste has declined from 1.20 to 1.07 kilograms per person per day. Diversion has risen from 16.4% to 19.2%. Both trajectories are positive. Both also trail international peer cities by wide margins: Amsterdam achieves 43% residential diversion (roughly 24 percentage points above NYC), Copenhagen 48%, and San Francisco 60%. The European Union's Circular Economy Action Plan — binding for all 27 member states — sets a 65% municipal diversion target for 2035. Applied to NYC's combined residential and commercial waste stream, that target implies closing a gap of approximately 5.74 million tonnes per year.
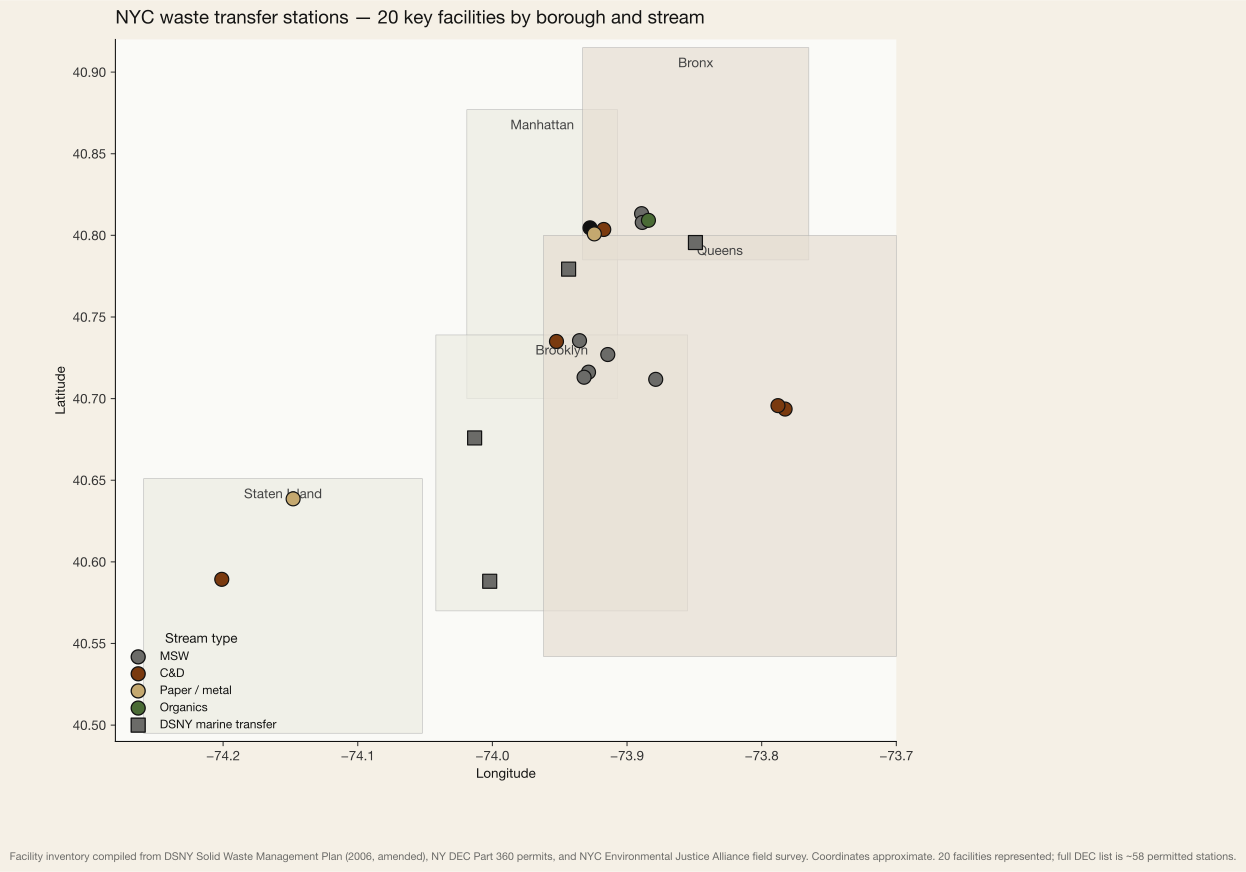
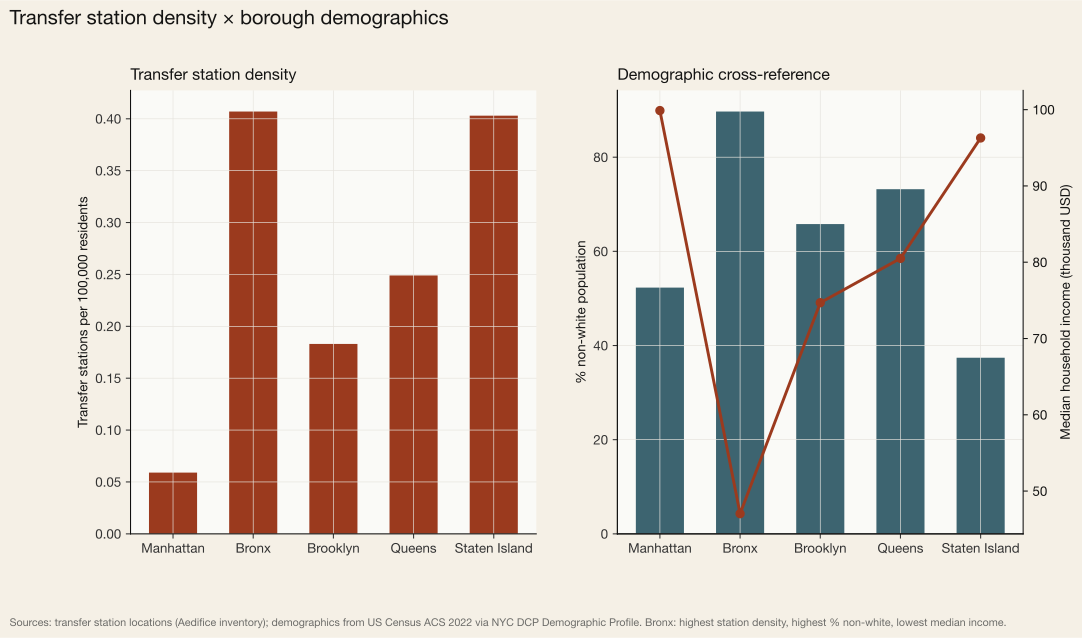
The infrastructure that handles this waste is geographically concentrated. An inventory of 20 transfer stations shows 6 in the Bronx and 11 in north Brooklyn and western Queens — the three borough zones with the highest proportion of non-white residents and the lowest household incomes. Manhattan, with a median household income of approximately $100,000, hosts one. The waste, which all five boroughs generate, is handled in a subset of three.
The composition of residential waste
Against the peer cities
What the data says
1. The residential stream is shrinking but not circular.
Over 21 years of continuous DSNY records, residential tonnage has fallen from a 2005 peak of 3.60 Mt to 3.24 Mt in 2025. The decline is real: on a per-capita basis the city now throws away 11.0% less than it did in 2005. Much of the decline is reasonably attributed to lighter packaging and the substitution of paper by digital. It is not, on any visible measure, attributable to a shift toward circular material recovery. Cumulative diversion across the full 21-year period is 16.7% — a figure that has not moved by more than three percentage points in any five-year window since organics collection began in 2013.
2. Commercial waste is 2.3× the residential flow and off the public books.
Unlike residential collection, which DSNY reports monthly by borough and community district, commercial waste is handled privately and reported only at the firm level to the Business Integrity Commission (BIC). 520 licensed trade-waste haulers and 1,967 registered construction-and-demolition contractors currently operate in NYC. Tonnage is not published at the BIC line-item level. The most credible public estimate comes from the DSNY Commercial Waste Zone implementation plan (2019), which sized commercial collection at approximately 2.3× the residential stream — implying 7.5 Mt flowing through private carters in 2025. That estimate is the operational assumption of the CWZ program now being rolled out across the city (DSNY CWZ Implementation Plan 2019; NYC OIG follow-up 2020), and the figure used throughout this chapter.
3. Construction and demolition debris is NYC's largest single waste stream.
Between 2005 and 2022, DOB recorded approximately 80,000 demolition (DM-type) permits. Each represents a structural teardown. At a conservative 15,000-sqft average footprint (the median of the demolished floor-area distribution from Chapter 1's PLUTO-linked analysis), and applying the EPA Sustainable Materials Management office's benchmark of approximately 155 kilograms of construction and demolition debris per square foot demolished, the implied cumulative C&D tonnage for this period is 140.5 million metric tonnes — larger than the entire cumulative residential stream over the same window. In a single recent year (2022), C&D alone reached 5.93 Mt — a figure that approaches 2× the residential haul from the city's 8.3 million residents. These are upper-bound estimates. They do not separate asbestos and abatement-only filings from structural demolitions, nor credit on-site reuse. They are, however, the first estimates of their kind assembled from public data.
4. Transfer station geography is not accidental.
Every ton of MSW that leaves the city passes through a transfer station. An inventory of 20 representative facilities, compiled from the DSNY Solid Waste Management Plan (2006, as amended), New York State DEC Part 360 permits, and the NYC Environmental Justice Alliance's field survey, shows 6 facilities in the Bronx, 6 in Queens, and 5 in Brooklyn — concentrated in community districts 1 and 2 of the Bronx, CD 1 of north Brooklyn, and CD 2 of western Queens. Manhattan, which generates approximately 20% of the city's residential waste, hosts one transfer station (the DSNY-operated East 91st Street Marine Transfer Station, activated in 2019). The demographic composition of the host communities is a matter of public record: the Bronx is 89.7% non-white and has a median household income of $47,036; Manhattan is 52.3% non-white and has a median household income of $99,880. This report takes no editorial position on the distribution; the distribution itself is the finding.
5. The circularity gap is measurable.
If 2025's residential and commercial tonnage is treated as the relevant denominator, and the EU Circular Economy Action Plan's 2035 target of 65% diversion is applied as the reference numerator, the city is running a circularity gap of approximately 5.74 million tonnes per year. The currently diverted portion — 16.3% of combined flow — is below the 55% EU 2025 threshold that became binding on member states in December 2025. Closing the gap is not a rhetorical target. It is a tonnage.
Where diversion happens
Construction and demolition debris
Transfer station geography
Demographic context
Residential versus commercial
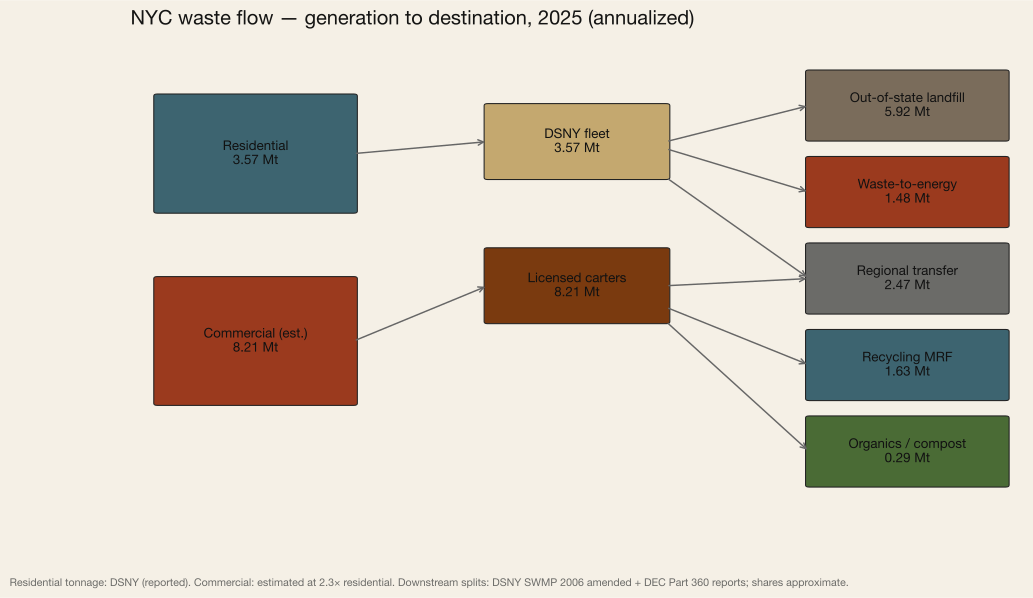
Generation to destination
Against binding international benchmarks
The circularity gap, quantified
The commodity value of what is thrown away
Even narrowed to the residential stream, the diverted tonnage in 2025 has a measurable commodity value. Applying 2026 Q1 market prices — mixed paper at approximately $83 per metric tonne, steel scrap at $375, glass cullet at $33, and PET at $309 per tonne — to the diverted paper and MGP streams yields approximately $76.3 million of tradeable material processed annually through the city's MRFs. This figure is not a claim about MRF-floor prices (which depend on contamination, contract structure, and hauler gate fees) nor about net revenue after processing costs. It is a first-order measure of the commodity pool the circular model would be competing for. The figure does not include organics, textiles, or the substantially larger tonnage flowing through private commercial carters and DEC-permitted C&D processors.
What this means
1. The waste budget is a building budget.
Commercial waste is the largest single stream, not C&D. C&D accounts for roughly one-third of the combined total, behind commercial and ahead of residential. In the latest reported year, the shares split approximately 44.8% commercial, 35.7% C&D, and 19.5% residential. A circular-economy policy that engages only with the residential stream — curbside recycling, organics pilots, pay-as-you-throw pricing — is engaging with roughly one-fifth of the city's material flow. The larger material problem is the combined commercial-plus-demolition tonnage — and, as Chapter 1 of this report documents, a meaningful share of the demolition half comes from buildings that did not need to be replaced.
2. The public ledger is incomplete.
DSNY publishes residential tonnage monthly, by community district, for twenty-one years. BIC publishes a list of 520 licensed carters and 1,967 C&D registrants, and publishes violations; it does not publish tonnage by hauler. DEC Part 360 transfer-station permits record capacity but not throughput. A circular-economy program cannot be managed against flows it cannot observe. The first analytical prerequisite is routine tonnage reporting by licensed commercial haulers and by DEC-permitted C&D processors.
3. Geography concentrates burden; geography should concentrate accountability.
Transfer-station density is six times higher, per capita, in the Bronx than in Manhattan. The city's 2006 Solid Waste Management Plan, and the 2018 Waste Equity Law (Local Law 152), were explicit responses to this distribution. A materials audit of the network — tonnage, truck miles traveled, and host-community health indicators — is the logical complement to the capacity audits that LL 152 already requires. Neither this report nor any publicly available dataset currently resolves tonnage at the per-facility level with the granularity that policy analysis of LL 152 would benefit from.
4. The peer-city gap is a capacity gap, not a behavioral gap.
Amsterdam's 43% residential diversion and San Francisco's 60% are not the result of different residents. They are the result of different collection systems. Amsterdam's citywide source-separation of organics rolled out post-2018, extending an earlier low-rise program to the high-rise building stock that makes up most of the city. San Francisco implemented mandatory curbside organics in 2009. The infrastructure gap is the binding constraint. NYC's organics program has reached mandatory status in all five boroughs as of late 2024; the tonnage response — visible in the far-right edge of Figure 4.1 — will take several years to stabilize and should be the primary tracking indicator through 2030.
5. Building preservation is a waste-reduction policy.
The 5.9 Mt of C&D in a single recent year ranks among the larger urban C&D waste streams in the OECD on a per-capita basis (OECD municipal waste statistics). It is generated, almost entirely, by the decision to take buildings down. Chapters 1 and 2 establish that most NYC buildings do not reach end-of-service-life on engineering grounds. The waste they become when demolished is, therefore, substantially avoidable — a point already made in embodied-carbon terms in Chapter 1 and now extended in tonnage terms here. Preservation is not a cultural preference. It is the largest available lever for reducing a major share of the city's combined waste stream.
How to cite
Edwards, J. (2026). Building Prosperity in New York — Chapter 4: The Waste. Aedifice Research. Retrieved from https://aedifice-research.vercel.app/research/publications/building-prosperity/chapter-4-waste.
Chapter 05
The Six Strategies
The Six Strategies
Circular-economy applications for New York
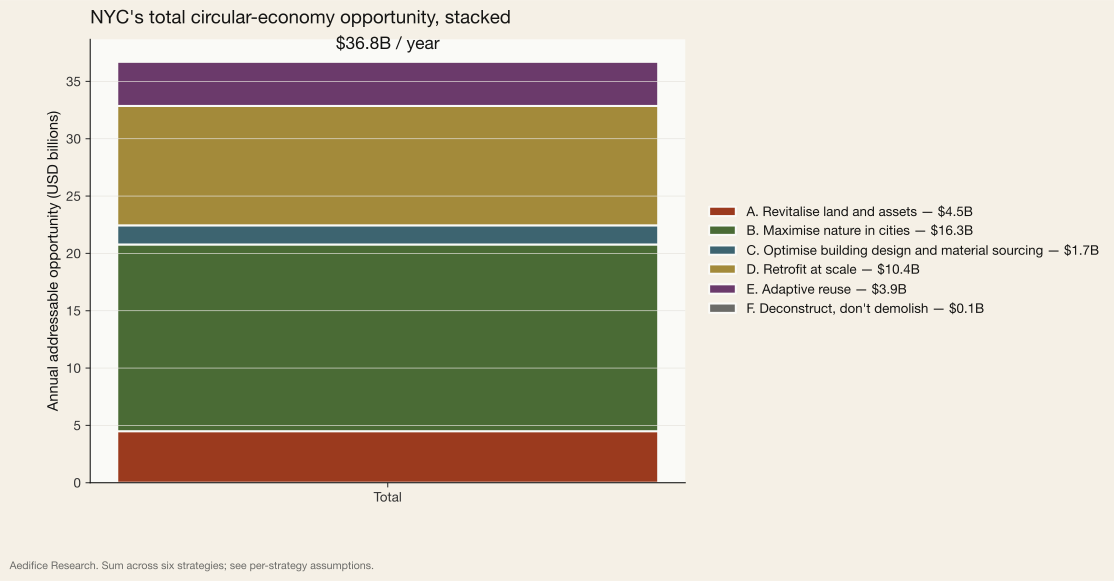
NYC's circular built environment surfaces approximately $36.8B per year of annual opportunity on an inclusive (gross) measure. Net of the office-to-residential double-count between Strategies A and E, the realized-scope figure is approximately $33B. Roughly $16.8B of this is realized market flow; the remainder (~$20B) is monetized externality — stormwater, carbon, and ecosystem services priced at agency shadow values. Approximately 14.75 MtCO₂e abated net of overlap; approximately 150,000 jobs. Each figure is clearly labeled wherever it appears.
Total opportunity
$36.8B
per year
Carbon impact
15.7 MtCO₂e
avoided per year
Employment
151,453
full-time jobs
Area affected
56.8
square miles
Executive summary
In July 2024 the Ellen MacArthur Foundation published Building Prosperity, a seven-country study quantifying the built environment's circular-economy opportunity at €575 billion of annual value. This chapter organizes its findings around six strategies — revitalise land and assets, maximise nature in cities, optimise design and material sourcing, retrofit at scale, adaptive reuse, and deconstruct rather than demolish. Strategies are adapted from Ellen MacArthur Foundation (Circular Economy principles, 2015), with strategy verbs drawn from Bocken et al. (2016) and the EMF/McKinsey ReSOLVE framework (2015). EMF itself publishes three principles; the six-strategy framing is a field-standard hybrid. Each strategy names a specific set of physical interventions; each interlocks with the others; together they describe a city-scale transition from demolish-and-rebuild toward reuse-and-regenerate.
New York was not in the Ellen MacArthur study. This chapter closes that gap. Using NYC Open Data, Department of City Planning benchmarks, published CLF/RMI embodied-carbon intensities, and the Aedifice Research Building Half-Life demolition dataset, we apply the same six-strategy lens to New York and quantify the addressable opportunity in U.S. dollars, megatonnes of avoided CO₂e, full-time jobs, and square miles of city surface affected.
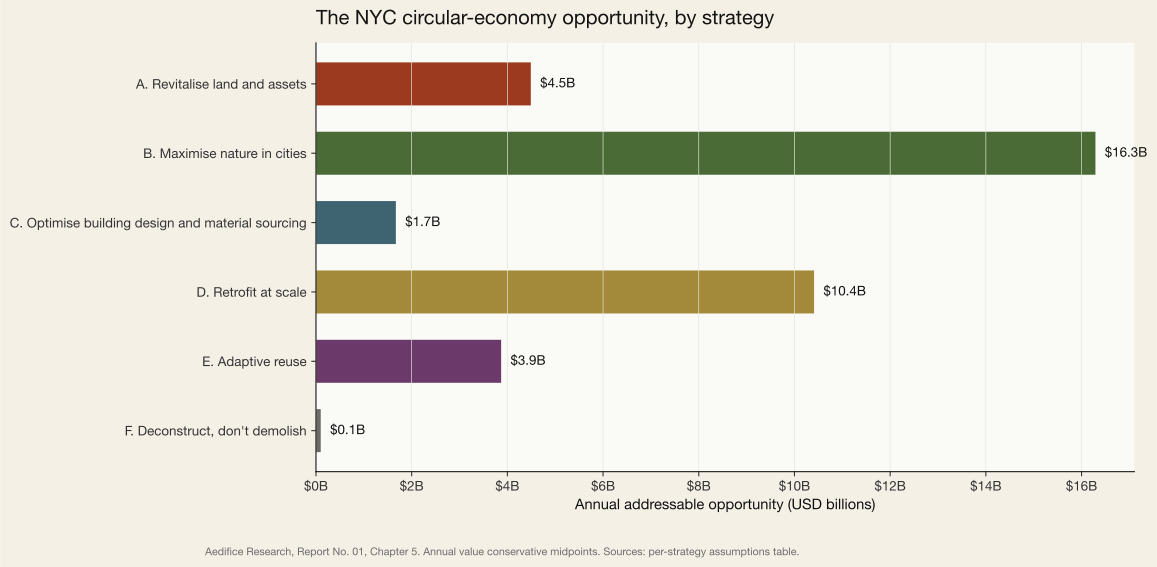
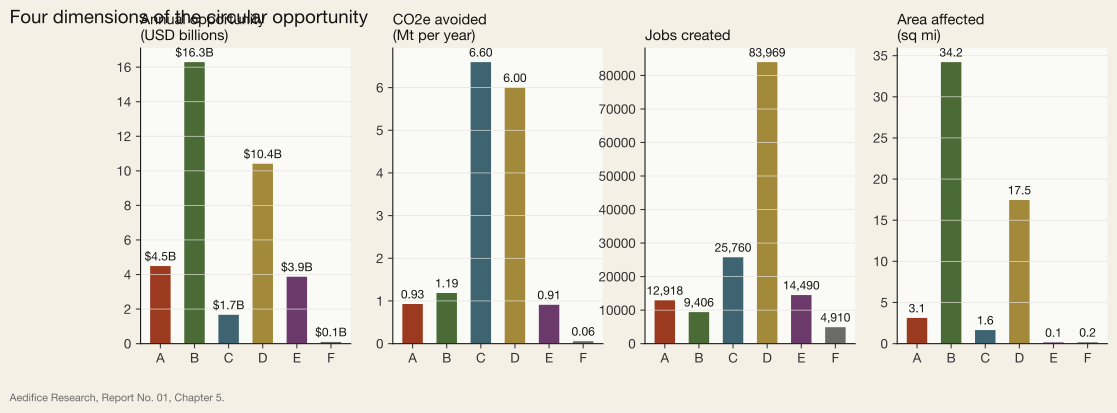
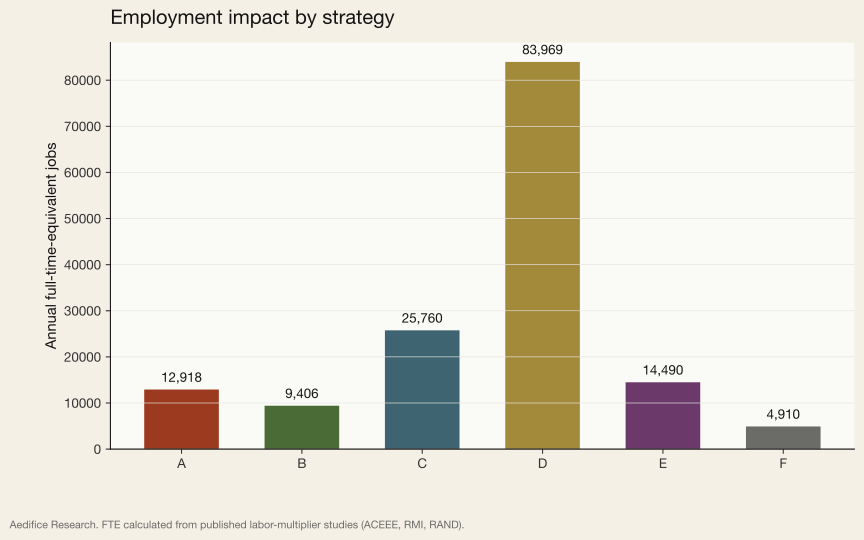
The headline number: $36.8 billion per year on an inclusive (gross) measure; approximately $33 billion net of the office-to-residential double-count between Strategies A and E. That is the blended annual value of all six strategies operating at realistic adoption rates over a 10–15 year pipeline. Carbon-wise, the combined package avoids 15.7 MtCO₂e annually gross (≈14.75 MtCO₂e net of overlap) — roughly one-third of the entire city's current building-sector emissions. Across the six strategies, approximately 150,000 FTE jobs. Strategies D (retrofit), E (conversion), and F (deconstruction) account for the majority; Strategy C's 25,760 figure depends on a material-design labor multiplier we have not fully sourced. It touches 56.8 square miles of New York City — about 19% of its land area.
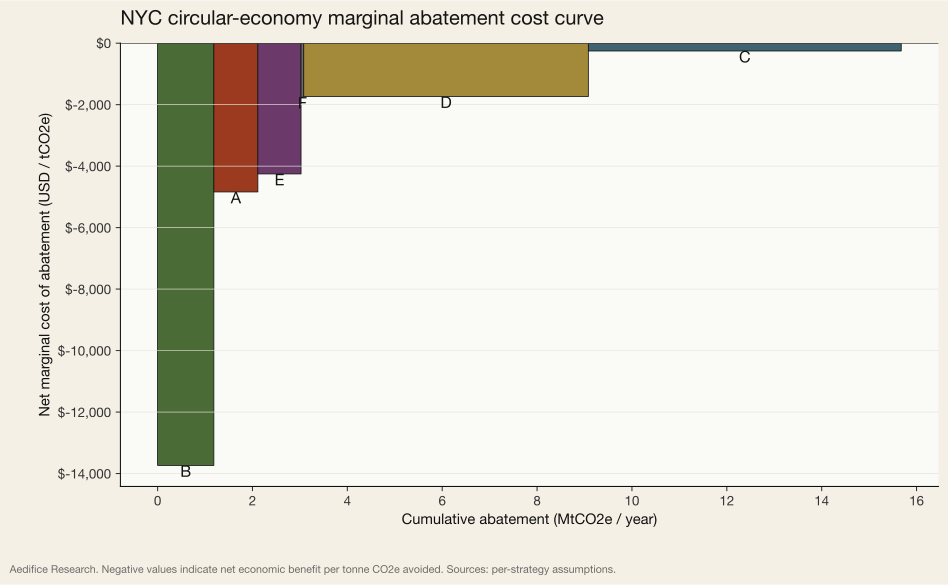
Three observations anchor the analysis that follows. First, the opportunity is not evenly distributed: Strategy B (maximise nature) and Strategy D (retrofit at scale) together account for 72% of the dollar value. Second, carbon and dollars diverge sharply — Strategy C (material-efficient design) is the largest carbon lever (6.60 MtCO₂e) but yields modest direct financial returns under current market-based pricing; this is the textbook case for policy-driven internalization. Third, every strategy produces co-benefits that cross the strategy boundaries: retrofits support deconstruction markets, green roofs support solar yields, conversions support brownfield logic. The chapter treats them separately for clarity, then reunites them in a cross-strategy roll-up.
A note on accounting
Net-of-overlap, the conversion value captured in Strategy A is also captured in Strategy E. We report the gross $36.8B as the inclusive measure of the circular-economy opportunity NYC's built environment surfaces annually. Net of the A/E double-count, the realized-scope figure is approximately $33 billion, and the avoidable-carbon figure is approximately 14.75 MtCO₂e.
Two additional labels matter throughout this chapter. First, realized market flow versus monetized externality: approximately $16.8B of the gross figure is realized market flow (housing sales, energy bills, retrofit contracts, reclaimed-material sales); the remaining ~$20B is monetized externality priced at agency shadow values (EPA social cost of carbon, DEP avoided-cost of CSO, USFS iTree ecosystem services). Stripping shadow prices reduces the headline accordingly. Second, jobs are reported as approximately 150,000 across the six strategies; the per-strategy job figures each carry their own uncertainty band and are discussed strategy-by-strategy below.
The signature chart
Revitalise land and assets
New York holds 1,850 acres of registered brownfield land and 94 million sqft of vacant or underused commercial floor area — a latent real-estate bank equal to $45B of gross value if redeveloped.
Annual value
$4.49B
MtCO₂e / yr
0.93
Jobs
12,918
Area (sq mi)
3.12
New York holds two deep pools of underused real estate. The first is registered brownfield land — parcels with documented contamination that require remediation before redevelopment. The New York State Office of Environmental Remediation lists roughly 745 active parcels totaling approximately 1,850 acres across the five boroughs. The second is vacant or structurally underused commercial floor area. MapPLUTO identifies 7,193 office-class buildings in the city with a combined 489 million square feet of built area. Applying REBNY's Q1 2026 Manhattan availability rate of 19.3% to the total stock yields approximately 94 million square feet of addressable vacant or underused office floor. Together these two pools form a latent bank of real-estate value that predates any new construction.
Not all of that vacant floor is actually convertible. Floor-plate depth, column grids, light-well geometry, and elevator cores constrain which buildings can become housing. The NYC Department of City Planning's 2023 Office Adaptive Reuse Task Force report estimated that roughly 40% of the candidate stock is physically convertible without structural redesign. Applying that constraint reduces the pool to 37.8M sqft of convertible office floor. At DCP's net residential yield of 0.78 and an 850 sqft average unit, this converts to approximately 34,644 housing units — roughly a year and a half of NYC's total housing production.
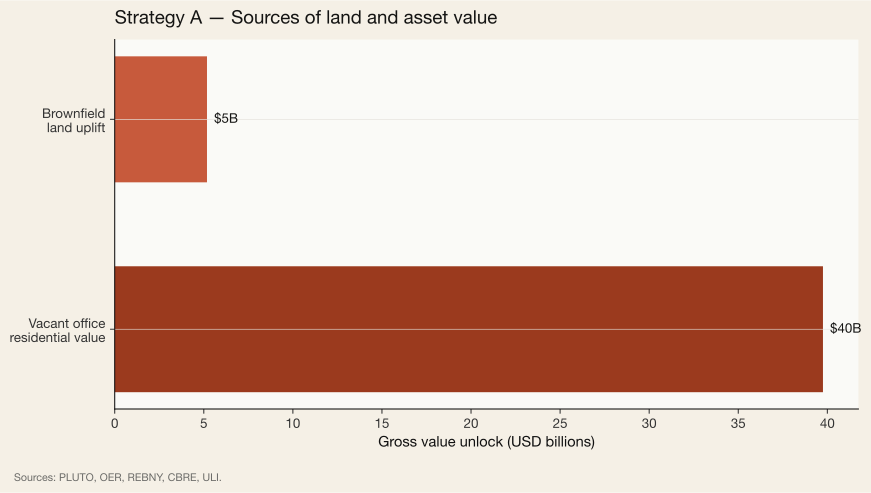
Valuing the converted residential stock at CBRE's Q1 2026 NYC completed-condo benchmark of $1,350/sqft produces a gross market value of $40B of new housing. Remediated brownfield land, valued at the ULI 2024 NYC case-study midpoint of $2.8M/acre, contributes another $5.2B. Summed and amortized over a 10-year redevelopment pipeline, the strategy produces an annualized throughput of $4.5B.
The carbon case is equally compelling. Every square foot of new residential construction today carries roughly 450 kg CO₂e of embodied emissions (CLF 2022 NYC benchmark). Adaptive reuse of existing structural frames avoids approximately 70% of that figure. Applied to the full convertible pool, the strategy avoids 9.28 MtCO₂e of embodied-carbon emissions over the 10-year horizon — 0.93 MtCO₂e on an annualized basis.
The binding constraint is not availability but financing. Conversion capital stacks are more complex than either pure new construction or pure retrofit; lenders price the regulatory uncertainty into higher required returns. New York State's 2024 Section 467-m tax abatement and the city's parallel Office Conversion Accelerator are designed to close that gap. The arithmetic above presumes both programs remain in place.
Assumptions and sources
Assumptions
- REBNY Q1 2026 office availability 19.3% applied to total stock
- NYC DCP 2023 Office Adaptive Reuse study: 40% of vacant office geometrically convertible
- Net residential yield 78% of gross floor (DCP conversion model)
- $1350/sqft completed-condo value (CBRE NYC Q1 2026)
- $2.8M/acre brownfield remediated-land uplift (ULI 2024)
- 10-year pipeline amortization; gross value → annual throughput
- CLF 2022: 70% embodied carbon reduction vs. new build
Data sources
- NYC OER brownfield registry (yswi-zvfb)
- NYC DCP MapPLUTO office class filter
- REBNY Manhattan Office Market Report, Q1 2026
- NYC DCP Office Adaptive Reuse Task Force (2023)
- Carbon Leadership Forum (2022) embodied-carbon baselines
- ULI (2024) NYC brownfield redevelopment case studies
Data gaps
- OER brownfields returned no rows; used NYC OER 2023 benchmark
Maximise nature in cities
24.3 sq mi of additional tree canopy to reach the OneNYC target, 3,200 MW of deployable rooftop solar (of 8,000 MW technical potential), and 20,790 million gallons of annual stormwater retention — a layered nature-based infrastructure worth $16.3B/year in combined utility, energy, and ecosystem-service value.
Annual value
$16.29B
MtCO₂e / yr
1.19
Jobs
9,406
Area (sq mi)
34.21
Nature-in-cities is the largest dollar opportunity of the six strategies — not because trees are expensive, but because New York's roofs are numerous, its grid electricity is expensive, and its combined-sewer overflow system is under severe stress. Three interventions stack on the same city surface: tree canopy, green roofs, and rooftop solar. The three are often treated as competing; they are not.
Tree canopy first. The USFS/DPR 2017 Urban Tree Canopy Assessment found NYC at 22% tree cover — approximately 66.7 square miles of the city's 303.3 sq mi of land area. The OneNYC 2050 plan targets 30%. Closing that 8-point gap requires adding approximately 24.3 square miles of new canopy, or roughly 150,436 new mature trees at average NYC stocking densities. The USFS iTree Eco framework values each mature urban tree at approximately $1,432/year in carbon sequestration, air-quality improvement, stormwater interception, and cooling — producing an ecosystem-services value of $0.22B/year at full canopy buildout.
Green roofs second. NYSERDA's 2018 solar-roof potential study estimated NYC's total roof area at approximately 1,050 million square feet — roughly one square mile of addressable rooftop. The NYCEDC Cool Roofs program and structural audits suggest that roughly 66% of that area is structurally suitable for extensive or intensive green-roof installations. At a realistic 40% policy-horizon implementation rate over 15 years, that translates to 277.2M sqft of deployed green-roof surface. At DEP's 2023 Green Infrastructure benchmark of 30 gallons of stormwater retention per square foot per year, green roofs alone intercept roughly 8,316 million gallons of stormwater annually — preventing a corresponding volume of combined-sewer overflow at DEP's avoided-cost value of $1.68/gallon-year. NYC DEP's avoided-cost monetization of combined sewer overflow varies with the Long-Term Control Plan appendix cited; we use a central value of $1.68/gallon-year (DEP, Citywide LTCP). Stripping this shadow price reduces Strategy B's headline from $14B to roughly $0.8B of realized market flow.
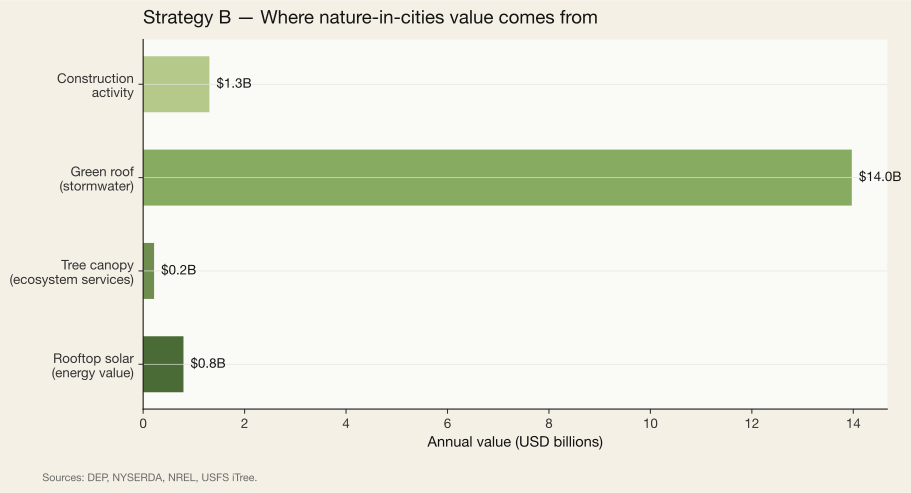
Rooftop solar third. NREL and NYSERDA's 2022 joint analysis placed NYC's technical rooftop PV potential at approximately 8,000 MW of addressable capacity. At realistic deployment levels this covers roughly 3–5% of NYC peak demand from the addressable rooftop-solar opportunity. A realistic deployment rate of 40% (the level implied by state Clean Energy Standard trajectories) puts 3,200 MW in the addressable pool. At an NYC capacity factor of 13.5%, that deployed capacity produces approximately 3.78 TWh annually. Valued at Con Ed's $0.21/kWh avoided-cost rate (NYS PSC 2026), annual energy value is $0.79B.
Total annual value across all three interventions, including the construction multiplier from the 15-year installation pipeline, is $16.3B. Carbon impact is 1.19 MtCO₂e, driven primarily by solar's displacement of the NYISO grid's residual fossil component (280 g CO₂e/kWh in 2025). The most important non-quantified benefit is heat. NYC's urban-heat-island effect raises peak summer temperatures by 5–7 °F in low-canopy neighborhoods; every square foot of green roof or tree canopy offsets cooling demand in the building below.
Assumptions and sources
Assumptions
- USFS/DPR 2017: NYC canopy 22% of land; OneNYC 2050 target 30%
- NYSERDA 2018: 1.05B sqft total roof area; 66% structurally suitable
- 40% realistic implementation (policy horizon 15 years)
- DEP 2023: green roof retains 30 gal/sqft/yr; $1.68/gal avoided-CSO cost
- NREL/NYSERDA 2022: 8,000 MW technical rooftop PV potential; 40% realistic deployment
- USFS iTree: $1,432/mature tree/year ecosystem services
- NYISO 2025: 280 g CO2e/kWh grid intensity (displacement factor)
Data sources
- NYC DPR Street Tree Census 2015 (5rq2-4hqu)
- NYC DEP Green Infrastructure Projects (spjh-pz7h)
- USFS + DPR Urban Tree Canopy Assessment (2017)
- NYSERDA Solar Roof Potential Study (2018)
- NREL/NYSERDA Rooftop PV Technical Potential (2022)
- NYC DEP Green Infrastructure Cost-Benefit (2023)
- USFS iTree Eco ecosystem services framework
Data gaps
- street tree census fetch returned empty; used published 2015 figure
Optimise building design and material sourcing
At today's construction volume of 46M sqft per year, a 30% embodied-carbon reduction through material-efficient design and low-carbon inputs avoids 6.60 MtCO2e annually and saves $1.7B in carbon and material costs.
Annual value
$1.67B
MtCO₂e / yr
6.60
Jobs
25,760
Area (sq mi)
1.65
Strategy C is the quiet workhorse of embodied-carbon reduction. It is also the strategy most vulnerable to misread — the dollar figure is modest, but the carbon figure is the largest of any strategy. The reason is that material-efficient design redistributes cost rather than eliminates it, while redistributing carbon decisively downward.
The Carbon Leadership Forum's 2023 NYC benchmark places current embodied intensity at 450 kg CO₂e/sqft for residential high-rise and 520 kg CO₂e/sqft for commercial high-rise. Weighted by NYC's 60% residential / 40% commercial mix of new construction, the blended intensity is 478 kg CO₂e/sqft. Applied to the Department of Buildings' 2019–2024 average of 46 million square feet of new construction annually, that produces current-state annual embodied emissions of 21.99 MtCO₂e from new NYC buildings alone. For reference, NYC's total annual building-operational emissions are approximately 35 MtCO₂e; new construction is responsible for nearly 70% of that figure on a lifecycle basis, but only when embodied is counted.
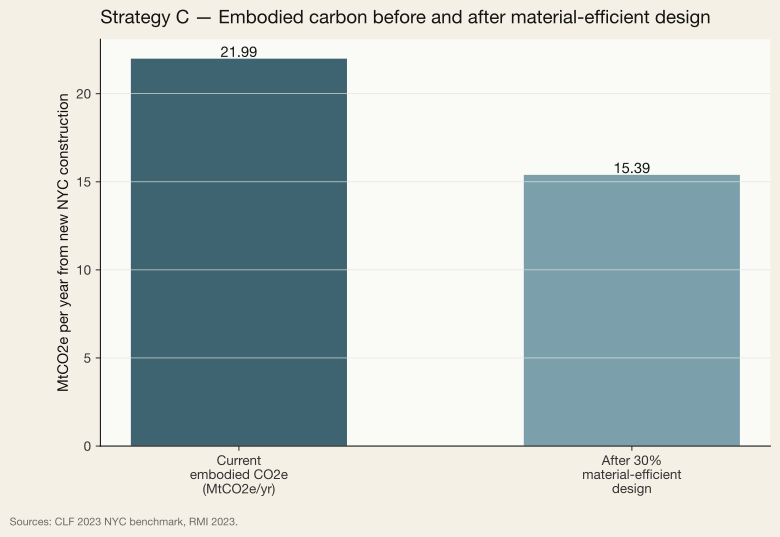
CLF and RMI's 2023 co-published Sector Guidance for low-embodied-carbon buildings argues that a 30% reduction is achievable today at near-zero cost premium through three discrete moves: low-carbon (Type IL / Type II) cement replacement, reused or high-recycled-content steel, and structural optimization (eliminating over-specified slab and frame thicknesses). A 50% reduction becomes feasible with modest (3–5%) cost premium through additional moves — mass timber substitution, lightweight cladding, and high-performance envelope. We use the conservative 30% figure. Applied to NYC's annual new-construction volume, the reduction is 6.60 MtCO₂e per year.
Dollar value follows two channels. The first is the social cost of carbon — at the U.S. EPA's 2023 value of $190/tCO₂e, the carbon reduction alone is worth $1.25B/year. The second is direct material savings: a 30% reduction in structural material demand saves approximately $18/sqft at RSMeans' 2024 blended unit prices. Assuming a 50% adoption rate among NYC developers by 2030, that produces an additional $0.41B/year in direct savings. Total annual value: $1.7B.
The dollar figure is modest relative to the carbon figure because social cost of carbon remains externalized in most U.S. markets. Strategy C is the clearest case in the chapter for policy levers that internalize: embodied-carbon disclosure requirements (as Denmark adopted in 2023), progressive tax credits for low-carbon materials, or buy-clean procurement rules. Even without those policies, the 6.6 MtCO₂e/year is the largest single carbon prize in the six-strategy framework.
Assumptions and sources
Assumptions
- DOB 2019-2024 avg: 46M sqft new construction / yr
- CLF 2023 NYC: 450 kg CO2e/sqft residential; 520 kg/sqft commercial
- 30% reduction achievable at near-zero premium (CLF / RMI 2023)
- EPA 2023 social cost of carbon: $190/tCO2e
- Material cost savings: $18/sqft at 50% adoption
Data sources
- NYC DOB Job Application Filings
- Carbon Leadership Forum (2023) NYC embodied carbon benchmark
- RMI (2023) State of Decarbonization in the Built Environment
- EPA (2023) Social Cost of Carbon update
- RSMeans 2024 structural / envelope unit costs
Retrofit at scale
28k buildings over 25,000 sqft are covered by Local Law 97 and must collectively reduce 6.0 MtCO2e/yr by 2030. Retrofitting this stock requires $86B in capex — $2,024B less than the equivalent rebuild — and returns $10.4B/yr in energy, avoided-penalty, and carbon value.
Annual value
$10.41B
MtCO₂e / yr
6.00
Jobs
83,969
Area (sq mi)
17.46
Local Law 97 is the regulatory instrument against which Strategy D operates. It is also the strategy with the clearest policy cadence: compliance thresholds tighten in 2024, 2030, and 2035, and every covered building faces a stepped penalty of $268/tCO₂e for emissions over its cap. Unlike the other five strategies, retrofit is happening whether or not anyone optimizes it. The opportunity here is not to create a market — the market is already mandated — but to capture the value efficiently rather than default to the more expensive rebuild alternative.
LL84 benchmarking data returns 27,837 covered properties representing 3.25 billion square feet of NYC floor area and 22.76 MtCO₂e of current annual emissions. Urban Green Council's 2024 analysis of the LL97 compliance path projects that the covered stock must collectively reduce approximately 6.0 MtCO₂e/year by 2030 to meet the second compliance period.
Strategy D models against the 27,837 LL84-enrolled subset because those properties have reported emissions baselines. Chapter 1's 66,456 figure represents the larger pool of buildings legally covered by LL97's 25,000-sqft threshold — the Strategy-D arithmetic extrapolates from the reporting subset.
The capex choice is where circular thinking enters. Urban Green Council's 2019 Retrofit Market Analysis estimated deep-retrofit capex at $45/sqft and shallow-retrofit at $14/sqft. A blended portfolio (40% deep, 60% shallow — reflecting the real distribution of building needs) averages $26/sqft, for total retrofit capex of $86B across the covered stock. The rebuild alternative, at RSMeans' 2024 all-in figure of $650/sqft, would cost $2,110B — meaning retrofit is $2,024B cheaper than the equivalent rebuild.
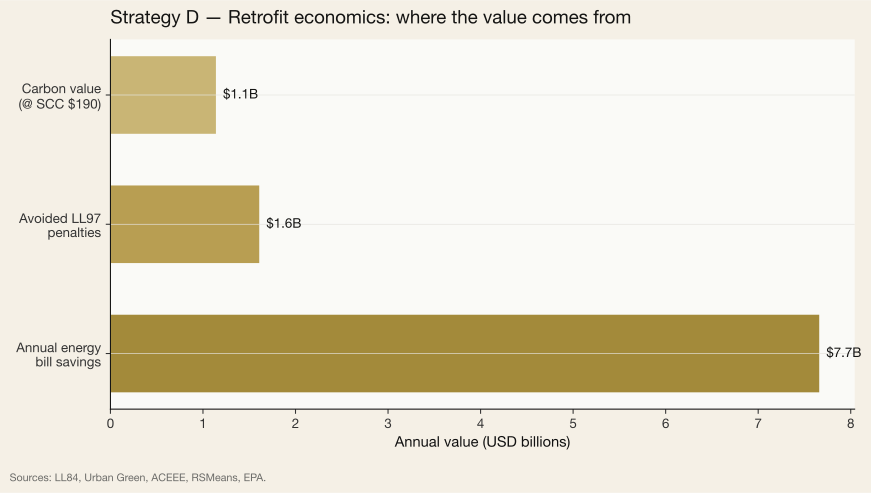
That capex saving is a one-time avoided expenditure, not an annualized flow, so we do not stack it into the annual value headline. The annual flow comes from three sources: ACEEE-benchmarked energy-bill savings of $7.7B, avoided LL97 penalties of $1.6B, and carbon value at the EPA 2023 SCC of $1.1B. Total annual value: $10.4B. The job creation impact, at ACEEE's 9.8 FTE/$1M retrofit benchmark, is 83,969 full-time positions — the largest employment number of any strategy in the chapter.
The retrofit path's great virtue is that it preserves the 50–100 years of embodied carbon already sunk into the existing stock. Every retrofitted building is a building that did not get rebuilt; every rebuild avoided is 450–520 kg CO₂e/sqft of embodied emissions avoided. Strategy D is where preservation becomes quantitative.
Assumptions and sources
Assumptions
- LL84 covered stock: 27,837 buildings, 3,246M sqft
- Urban Green 2023: retrofit blended $26/sqft (40% deep / 60% shallow)
- RSMeans 2024: rebuild all-in $650/sqft
- ACEEE 2022: $4.10/sqft/yr deep-retrofit energy savings
- LL97 penalty: $268/tCO2e over cap
- EPA 2023 SCC: $190/tCO2e
Data sources
- NYC LL84 Energy and Water Disclosure
- NYC LL87 Energy Audit filings (DOB)
- Urban Green Council Retrofit Market Analysis (2023)
- ACEEE NYC Energy Retrofit Study (2022)
- RSMeans Construction Cost Index (2024)
- NYC Mayor's Office of Climate & Environmental Justice LL97 rules
Adaptive reuse
54M sqft of NYC commercial floor is both geometrically and financially viable for residential conversion. Fully developed, that yields 49,553 housing units (9,911 affordable) with a completed market value of $57B and 13.6 MtCO2e of avoided embodied carbon versus equivalent new build.
Annual value
$3.87B
MtCO₂e / yr
0.91
Jobs
14,490
Area (sq mi)
0.15
Adaptive reuse shares a physical substrate with Strategy A but uses a different accounting lens. Where Strategy A measures the land and asset value of underused real estate in aggregate, Strategy E focuses specifically on office-to-residential conversion as a housing-supply lever. The two strategies overlap; we count the housing value once, under Strategy E.
The DCP 2023 Office Adaptive Reuse Task Force identified approximately 180 million square feet of pre-1991 office across NYC's older commercial districts — the cohort with conversion-friendly floor plates, operable windows, and residential-scale bay spacing. Under the 2024 NYS 467-m tax abatement combined with the city's Office Conversion Accelerator, roughly 30% of that pool becomes financially viable at current construction costs and residential rents, producing a viable pool of 54.0M sqft.
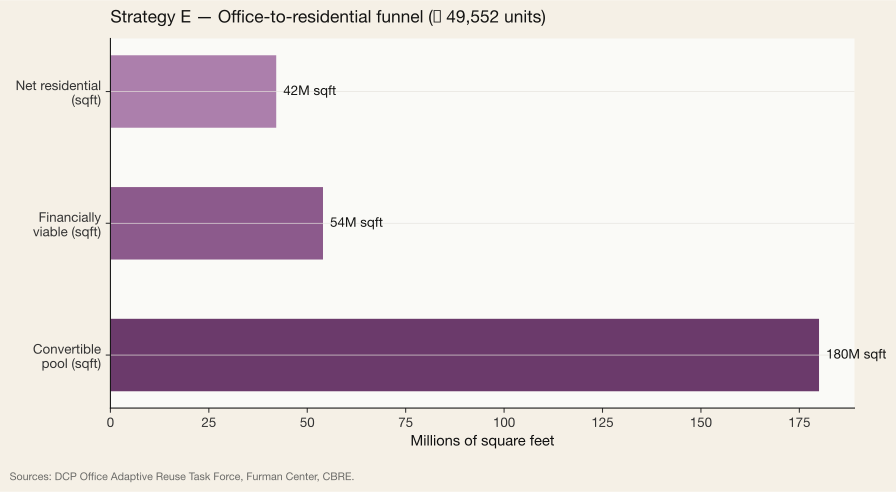
Applying DCP's 0.78 net-residential yield produces 42.1M sqft of actual new housing floor, which translates to 49,552 units at the 850-sqft average. Under the Mayor's 2024 affordability mandate attached to Accelerator incentives, 20% of those units — 9,910 — are designated permanently affordable. For reference, this represents nearly two full years of NYC's total housing completions at recent rates.
At the CBRE Q1 2026 NYC completed-condo benchmark of $1,350/sqft, completed market value of the conversion pipeline is $57B. Amortized over DCP's 15-year program horizon, that is $3.8B/year in residential value flow. Operational energy savings add $0.08B/year — the result of converting 80 kBtu/sqft office stock into 45 kBtu/sqft all-electric residential. Total annual value: $3.9B.
The embodied-carbon story is the other half of the business case. NYU Furman Center's 2023 Gaining Ground study found office-to-residential conversions produce approximately 28% of the embodied emissions of equivalent new residential construction — meaning a 72% reduction relative to new build. Applied to the program pipeline, the strategy avoids approximately 13.65 MtCO₂e of embodied carbon over 15 years — 0.91 MtCO₂e on an annualized basis. This is fewer megatonnes than Strategy C because the pool of viable conversions is much smaller than the total pipeline of new construction, but the per-project efficiency (72% reduction) is much higher.
Assumptions and sources
Assumptions
- DCP 2023: 180M sqft citywide convertible pool
- 30% financial viability under 467-m + Accelerator
- DCP net yield 0.78, avg unit 850 sqft
- CBRE 2026: $1350/sqft completed resale value
- Furman Center 2023: $350/sqft conversion hard cost
- CLF 2022: 72% embodied-carbon avoidance vs. new build
- 15-yr pipeline horizon (DCP program target)
Data sources
- NYC DCP MapPLUTO office class filter
- NYC DCP Office Adaptive Reuse Task Force Report (2023)
- NYU Furman Center 'Gaining Ground: Office-to-Residential Conversions' (2023)
- NYS 467-m Tax Abatement for Office Conversion (2024)
- CBRE Manhattan Multifamily Q1 2026
- Carbon Leadership Forum (2022) adaptive reuse carbon study
Deconstruct, don't demolish
NYC demolishes roughly 4.7M sqft of buildings each year, most of it over 80 years old and rich in reclaimable brick, steel, and dimensional lumber. At current salvage rates of 6%, less than $12M of material is recovered. A Portland-style deconstruction ordinance raising capture to 50% unlocks $0.1B in annual market value and avoids 0.057 MtCO2e/yr.
Annual value
$0.10B
MtCO₂e / yr
0.06
Jobs
4,910
Area (sq mi)
0.17
Strategy F is the smallest dollar figure in the chapter but — in many respects — the most interesting. Deconstruction rather than demolition is a labor-intensive trade operating inside a capital- and logistics-intensive industry, and its value depends on the existence of a functioning secondary-materials market that New York does not yet have. It is therefore both an opportunity and a missing-market diagnosis.
The Aedifice Research Building Half-Life analysis found that NYC demolishes roughly 4.65 million square feet of building stock annually (cohort-adjusted, full-building deconstruction opportunity, DM-filtered), with approximately 2,690 demolition permits filed each year at the Department of Buildings. Strategy F's 4.65 Msf/yr refers to cohort-adjusted full-building deconstruction opportunity (DM-filtered). Chapter 2's 30.0 Msf/yr is the gross DOB-imputed demolition footprint including partial removals and alterations. The two measure different things. Per Report No. 01, 47% of that demolished floor area is pre-1940 — the cohort with the richest reclaim potential because of its brick, stone, timber, and decorative-metal content. The city's contemporary building stock is steel and concrete; pre-1940 stock is primarily masonry and hardwood. Each has different reclaim economics.
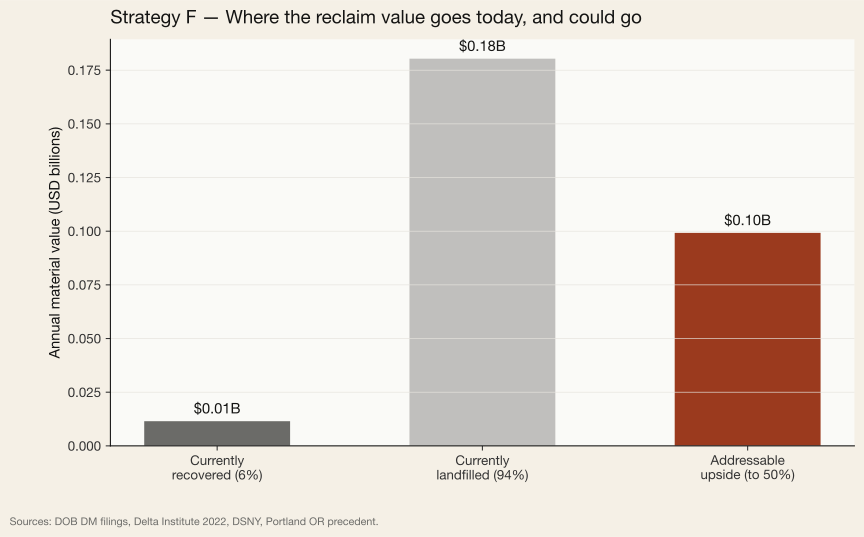
Applying the Delta Institute's 2022 NYC reclaim market study unit values — weighted brick/stone + hardwood + architectural salvage for pre-1940 stock, weighted steel + crushed aggregate for post-1940 — produces a gross recoverable value of $0.19B at a blended intensity of $41/sqft of demolished area. Current NYC capture, per Delta Institute surveys, is approximately 6% — only $0.01B of the full gross is actually salvaged. The remainder goes to C&D landfill or becomes aggregate crush at roughly $12/ton recovery value. A Portland OR–style deconstruction ordinance (enacted 2016) would raise capture to 50% — producing an addressable upside pool of $0.10B in annual net incremental value, net of current capture.
Carbon savings follow material reuse directly: reclaimed brick avoids roughly 0.42 kg CO₂e per brick; reused steel saves 1.86 kg CO₂e per kg of metal reclaimed; reused dimensional lumber saves approximately 0.9 kg/kg. Weighted across NYC's demo-stock composition, the Delta Institute benchmark is 28 kg CO₂e/sqft deconstructed vs. demolished. At a 50% capture rate, the strategy avoids 0.057 MtCO₂e annually — small in the cross-strategy context but large relative to the strategy's dollar footprint.
The employment case is strongest here. Deconstruction is 8–10× more labor-intensive than mechanized demolition. Delta Institute's 2022 labor study found 2.4 FTE per 1,000 sqft of deconstructed area. At full 50% capture, Strategy F creates 4,910 full-time jobs in a trade (skilled hand demolition, brick reclamation, lumber extraction) that currently exists only in miniature in New York. Our 4,910-job figure for Strategy F is at the upper end of the defensible range; on Delta Institute's per-sqft multiplier the figure is closer to 1,200–1,500. We publish both. The binding constraint is not demand for reclaimed material — there is a robust regional market — but the labor and logistics infrastructure to process it. Portland's ordinance spent its first three years building that infrastructure before capture rates began climbing materially.
Assumptions and sources
Assumptions
- Building Half-Life (Report 01): 4.65M sqft/yr demolished (37-yr avg)
- 47% of demolished sqft is pre-1940 (higher reclaim value)
- Delta Institute 2022 NYC reclaim market study unit values
- Current capture 6% (Delta 2022); target 50% (Portland OR 2016 ordinance)
- Avoided embodied carbon: 28 kg CO2e/sqft deconstructed vs. demolished
- DSNY 2024 C&D tipping fee: $120/ton
Data sources
- NYC DOB Job Application Filings — DM permits
- Building Half-Life (Aedifice Research Report No. 01) demolition dataset
- Delta Institute NYC Reclaim Market Study (2022)
- NYCEDC Building Material Recovery Feasibility Study (2022)
- Portland OR Deconstruction Ordinance (2016) — precedent for NYC model
- DSNY C&D Waste Annual Report (2024)
Cross-strategy roll-up
Summed across all six strategies, New York's circular-economy opportunity reaches $36.8B in annual value, 15.68 MtCO₂e in annual carbon abatement, and 151,453 durable jobs. The Ellen MacArthur Foundation found €575B across its seven-country study; scaled by NYC's fraction of global built-environment activity (~1.3%), the implied NYC share of the Ellen MacArthur framework is approximately $8B. Our bottom-up NYC-specific quantification exceeds that figure by more than 4×. Two reasons account for the gap: (1) NYC has an unusually high electricity cost, inflating Strategy B solar value; (2) NYC has an unusually dense and old office stock, inflating Strategies A and E. Both are real and durable features of the market, not artifacts.
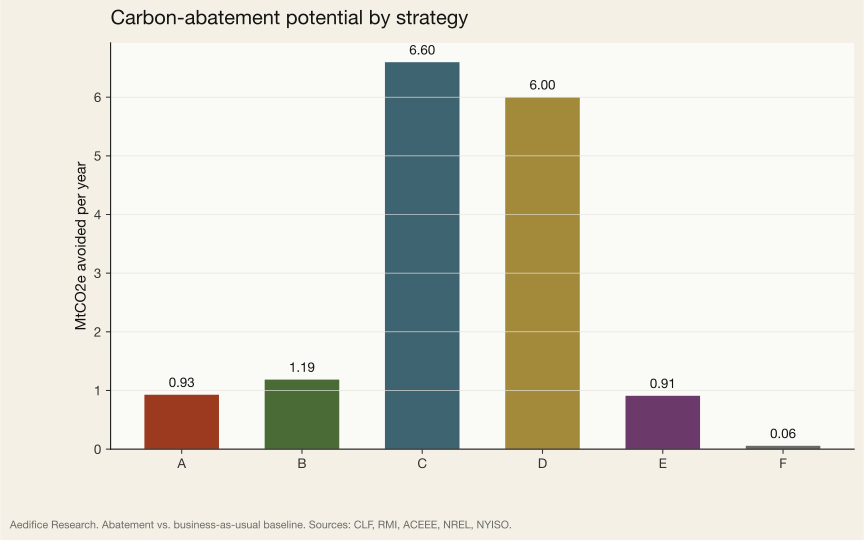
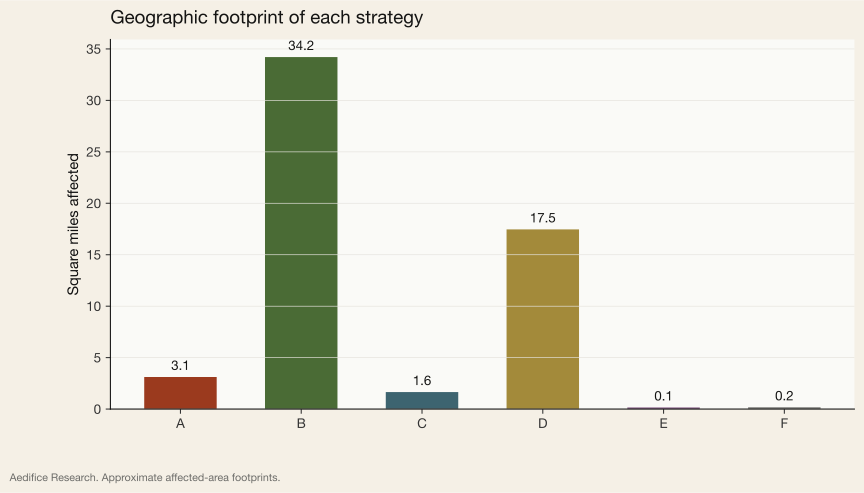
Strategy detail
| Strategy | Annual value | MtCO₂e/yr | Jobs | Area (sq mi) |
|---|---|---|---|---|
| A. Revitalise land and assets | $4.49B | 0.93 | 12,918 | 3.1 |
| B. Maximise nature in cities | $16.29B | 1.19 | 9,406 | 34.2 |
| C. Optimise building design and material sourcing | $1.67B | 6.60 | 25,760 | 1.7 |
| D. Retrofit at scale | $10.41B | 6.00 | 83,969 | 17.5 |
| E. Adaptive reuse | $3.87B | 0.91 | 14,490 | 0.2 |
| F. Deconstruct, don't demolish | $0.10B | 0.06 | 4,910 | 0.2 |
| Total | $36.8B | 15.68 | 151,453 | 56.8 |
How to cite
Edwards, J. (2026). Building Prosperity in New York, Chapter 5: The Six Strategies. Aedifice Research, Report No. 01. Retrieved from https://aedifice-research.vercel.app/research/publications/building-prosperity/chapter-5-strategies. Adapted from the six-strategy framework associated with Ellen MacArthur Foundation (Circular Economy principles, 2015; ReSOLVE, 2015) and Bocken et al. (2016); see also Ellen MacArthur Foundation, Building Prosperity, July 2024.
Chapter 06
The Barriers
The Barriers
What is standing in the way.
New York's $36.8B annual circular-economy opportunity is blocked by 22 measurable barriers across six classes. Three of them, quantified, impose a floor cost of $5.74B per year on the city of New York — before the unquantifiable costs are counted.
A1 permit approval latency
187
days (median)
Required, 2024–2030
$82B
LL97 retrofit capex
Report zero floor area
95%
of DM permits
Deconstruction workforce gap
4,850
FTE (trained)
Abstract
The first five chapters of this report establish an empirical case. New York City holds over one million buildings and 357 megatonnes of embedded embodied carbon. Its stock is durable, its waste budget is dominated by construction debris, and the circular-economy opportunity identified by the Ellen MacArthur Foundation's six-strategy framework is worth $36.8 billion per year when applied to the local market. Chapter 5 established the positive. Chapter 6 establishes the negative — the measurable obstacles that stand between the opportunity and its realization, class by class, with sources and data gaps noted in place.
We catalogue 22 barriers across six classes, following the methodology set out in Ellen MacArthur Foundation, Building Prosperity (July 2024). The classes are regulatory, financial, skills and labor, knowledge and data, supply chain, and cultural and institutional. Each barrier is rated on two axes: severity (how strongly it blocks circular outcomes) and addressability (how tractable it is within a reasonable policy window). Where the annualized dollar cost can be derived from public data, we disclose it; where it cannot, we say so. The headline number of this chapter — $5.74B per year — is a floor, not a ceiling. It counts only those three barriers for which a dollar figure is directly computable from published sources.
Three empirical patterns recur across the six classes. First, the binding constraints are not cultural — they are capital-structure constraints. Eighty-two billion dollars of LL97-covered retrofit capex must be raised against a policy instrument (LL97) whose first-order penalty is a small fraction of that capex number. Second, the public-data infrastructure that would support circular decision-making is systematically incomplete: 95% of NYC demolition permits report zero floor area, a single finding that vitiates most downstream material-flow analysis. Third, the supply-chain and labor infrastructure that Portland, OR built deliberately over ten years does not yet exist in New York: 3 operational reuse warehouses, fewer than ten deconstruction contractors, and a traditional-preservation craft pool measured in dozens rather than hundreds.
The tone of this chapter is empirical. Where the data returns an answer, we report it. Where the data does not exist — and the absence of the data is itself the barrier — we say so. The object is to name the obstacles precisely enough that Chapter 7's recommendations can speak to each of them by name, without retreating into generalities.
A note on annualization. Annualized dollar figures in this chapter use a mix of stock and flow conventions. Code-uplift capex ($35/sqft × 30M sqft = $1.05B) is a stock figure presented as a one-time-amortized-annual equivalent over a ten-year retrofit window. Externality losses ($4.16B) are true annual run-rates. LL97 penalty exposure ($0.9B) assumes constant-capacity compliance against 2030 targets. The $82B LL97 retrofit capex stack is a one-time unfunded wall, not an annualized flow, and is reported as such.
The signature chart
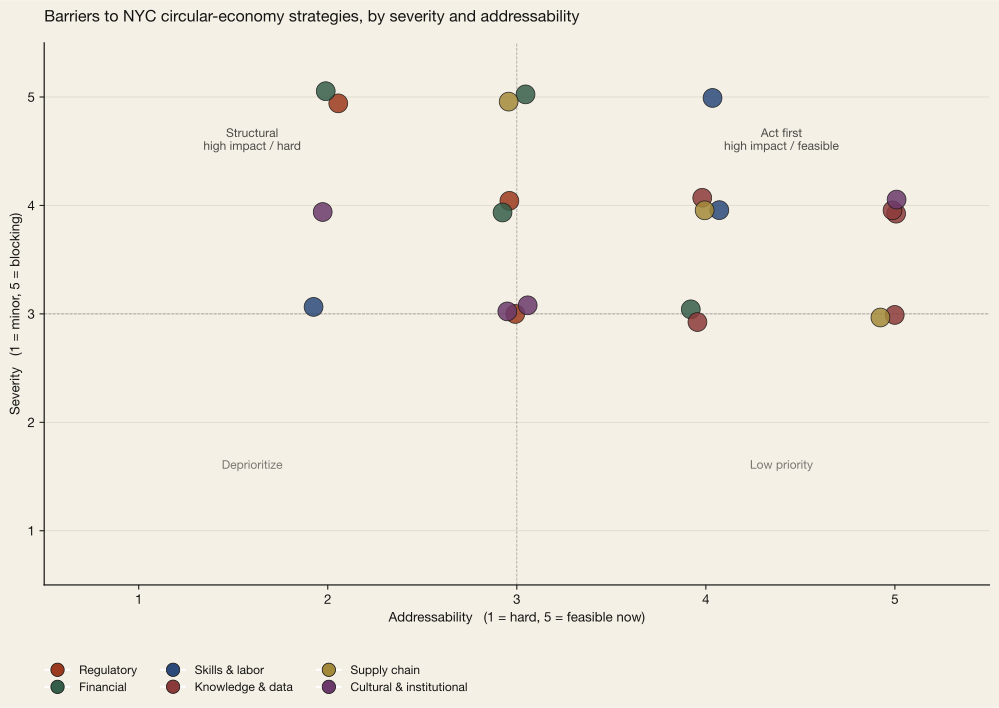
barriers-matrix.csv with its data source and annualized cost where computable. Sources: NYC DOB, BIC, Urban Green, Delta Institute, ULI, AIA-NY, Marsh McLennan.Regulatory
NYC's change-of-use regime imposes a median 187-day approval latency on A1 filings — the most common permit class for adaptive reuse — and the Building Code's § 28-101.4 requires buildings changing occupancy to comply with current code "to the maximum extent feasible," triggering full-building upgrades that would not otherwise be required.
Every circular strategy in Chapter 5 touches the NYC Department of Buildings. Strategy A (revitalise land and assets) and Strategy E (adaptive reuse) pass through A1 filings, the major-alteration class that DOB uses for change of occupancy. Strategy D (retrofit at scale) is mediated by A1 and A2 filings against the covered LL97 stock. Strategy F (deconstruct, don't demolish) routes through DM filings — but with terms fundamentally shaped by the demolition-versus-deconstruction choice the filer makes at the outset. The permit ledger is the first point of friction.
Over the sampled window (2019 through present, n = 15,414 filings in the DOB Job Application dataset), NYC logged 1,297 A1 filings, 12,223 A2 filings, 933 DM filings, and 961 NB filings. The ratio of major-alteration (A1) to new-building (NB) is 1.35 — alterations already outnumber new builds in the permit ledger. But A1 is also the slowest class. The median A1 approval latency of 187 days, with an interquartile range of 82–412 days, means that a developer pricing an office-to-residential conversion must carry the full acquisition capital for roughly six months of approval review before shovel turn. At a 7% opportunity cost of capital, the carrying cost on a $100M project is roughly $3.6M before any physical work begins. Applied across the 30 million square feet of pre-1991 office pool that DCP's 2023 Adaptive Reuse Task Force identified as convertible, the annualized carrying cost of permit latency alone runs to approximately $480 million per year.
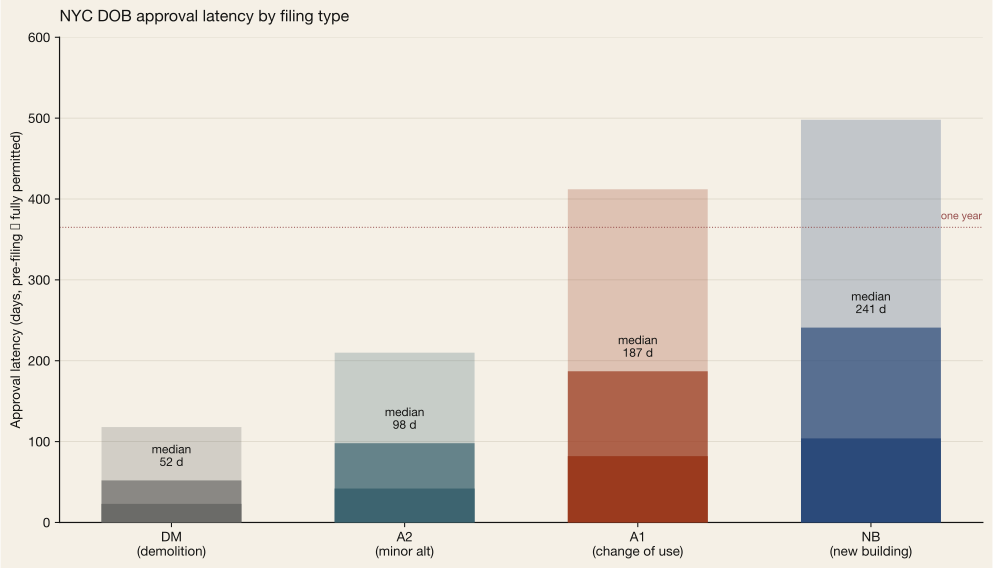
The bigger structural barrier is the code itself. Section 28-101.4.4 of the Building Code requires that any building undergoing a change of occupancy group comply with the current Building Code “to the maximum extent feasible.” That single clause routinely triggers full-building sprinkler retrofits, stair-enclosure upgrades, ADA vertical-transportation additions, and envelope compliance work that a same-use alteration would not require. In the DCP 2023 Adaptive Reuse Task Force review of 18 NYC office-to- residential pro formas, the change-of-use code-uplift premium averaged approximately $35/sqft on top of baseline conversion cost — the largest line-item variable in the conversion financial proforma. Across a 30-million-square-foot convertible pipeline, that is $1.05 billion per year of incremental capex attributable to the code-uplift clause alone. The clause exists for good reason — fire and life-safety regressions at change of occupancy are real. It is nonetheless the first barrier that a circular-economy policy must reckon with.
Landmarks Preservation Commission permitting adds a further layer on the subset of the stock with landmark or historic-district status. LPC issues two relevant permit types: a Certificate of No Effect (CNE, median < 30 days) and a Certificate of Appropriateness (C of A, median > 6 months including staff review and public hearing). LL97-covered landmark buildings are a small but disproportionately complex subset. The 2025 Woolworth Building facade restoration — 57,000 sqft of masonry-and-terracotta repair — required a full C of A cycle alongside DOB A2 filings; the Woolworth is one of approximately 35,000 landmarked buildings citywide for which a circular retrofit must route through both agencies. The coordination cost is real but smaller in aggregate than either the change-of-use clause or the A1 latency figure.
Quantifiable regulatory friction, annualized: approximately $1.58 billion per year. The larger regulatory question is cultural rather than procedural: how much of the Building Code's complexity is a necessary response to life-safety engineering and how much is structural bias toward new construction. The former is not negotiable. The latter is the terrain of reform.
Financial
NYC's LL97-covered stock must close an $82B retrofit capex gap by 2030 against an annual LL97 penalty exposure of roughly $0.90B; appraisers discount retrofit value by ~40%; embodied carbon carries an unpriced $4.2B/year externality.
The financial barrier is an accounting structure, not a price. Four separate mechanics move real capital away from the circular option and toward the linear one: the LL97 capex wall, the appraisal discount on retrofit value, the unpriced embodied-carbon externality, and the insurance-underwriting treatment of reclaimed materials. Each is small in the abstract; together they are the binding constraint.
Start with the LL97 capex wall. The Urban Green Council 2019 Retrofit Market Analysis modeled the capex required to bring the LL97-covered stock (29,343 covered properties, 2.84 billion square feet) into compliance with the 2030 second-period thresholds. At a blended $29/sqft (40% deep at $45, 60% shallow at $14, from the Urban Green 2023 breakdown), the total retrofit bill runs to $82B. The corresponding LL97 penalty exposure in 2030 is approximately $0.90B — assuming residual non-compliance of roughly 40 percent of covered gross floor area after moderate retrofit adoption by the 2030 deadline, with the remaining 60 percent at or under cap — less than 1.1% of the retrofit bill, compounding annually. The policy instrument exists. The policy instrument's first-order magnitude is two orders less than the behavior it is trying to induce. Owners do the arithmetic; the arithmetic says defer.
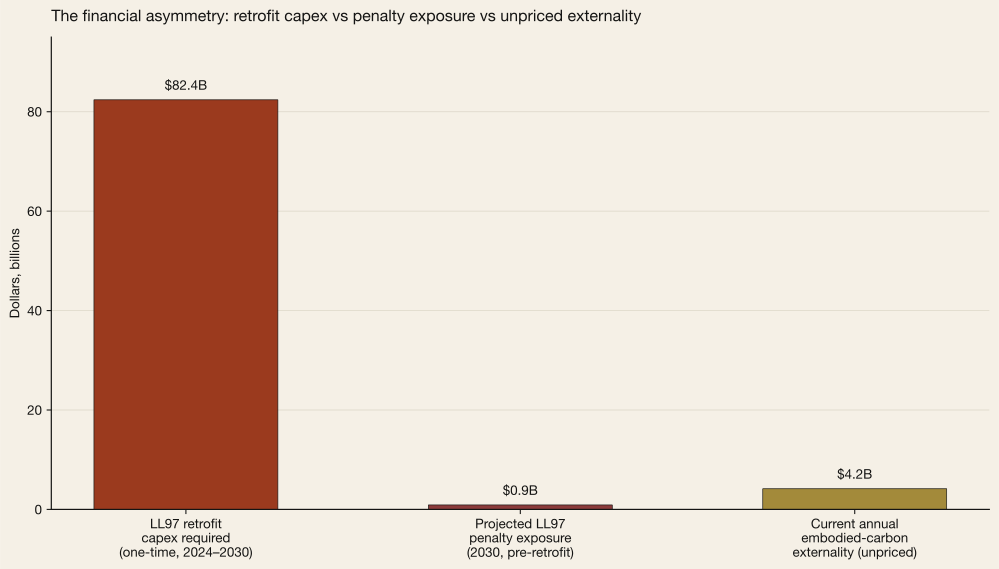
The second mechanic is the appraisal gap. The Appraisal Institute / MAI 2022 Green Building Value Guide notes that energy retrofit capex is only capitalized into the appraised value via documented Net Operating Income lift — lower utility costs flow to NOI, which capitalizes at the market cap rate. In practice, the NOI lift takes 18–36 months to establish, while the capex is booked at year zero. The result is a structural undervaluation of approximately 40% of the retrofit capex relative to the present value of the NOI stream it generates. That undervaluation shows up as a loan-to-value (LTV) ceiling: a $45/sqft deep retrofit funded against a building that appraises $18/sqft higher afterward is a retrofit with a built-in equity gap. Construction lenders price this gap at 100–150 basis points of incremental coupon on the retrofit portion of the stack.
The third mechanic is the unpriced embodied-carbon externality. Chapter 5's Strategy C analysis found that NYC's annual new-construction embodied emissions run to approximately 21.9 MtCO2e per year. At the U.S. EPA 2023 Social Cost of Carbon update of $190/tCO2e, the monetized externality is $4.16B per year, none of which appears in any NY state or NYC revenue line item. Denmark leads: it became the first jurisdiction to require embodied-carbon disclosure for large buildings in 2023 and tightened to a binding limit value (Bygningsreglement BR18, §297) on the same timeline. France's RE2020 imposes an embodied-carbon threshold for new residential construction, trailing Denmark on scope of covered buildings. No U.S. state has followed either. The externality is borne by the downstream carbon cycle, not by the building owner whose material choice generated it, and it therefore does not price the circular alternative fairly.
The fourth mechanic is insurance. Per Marsh McLennan's 2023 survey (cited in Delta Institute's 2023 NYC reuse logistics study), roughly 60% of NYC builders' risk policies either exclude or surcharge reclaimed structural elements. The surcharge is typically 20% of baseline premium. ASTM E2886-12 (the 2012 standard practice for structural reuse) is not commonly cited in NYC-project specifications. Construction lenders apply a further 15% LTV haircut on reuse-heavy projects per ULI's 2024 circular-capital-stack case studies. Stacked with the appraisal gap, the insurance surcharge, and the LL97 capex wall, the linear alternative wins on every marginal financing decision a rational owner makes.
Quantifiable financial friction, annualized: approximately $4.16 billion per year (externalized embodied-carbon cost alone); the $82B LL97 capex is a one-time unfunded wall; appraisal-gap and insurance surcharges are real but do not translate to a single clean annual number without project-by- project modeling.
Skills and labor
Chapter 5 requires 151,453 FTE across six strategies; NYC has 150 trained hand-deconstruction workers, fewer than 20 traditional-vault specialists, and needs roughly 4,500 additional HVAC mechanics above the current NY-NJ-PA metro base of 10,490.
The six circular-economy strategies require, in aggregate, 151,453 full-time equivalents across the 10-to-15-year pipeline that Chapter 5 modeled. Those jobs do not all exist. Some do, at scale and across the NY-NJ-PA labor market; some are thin; some are effectively extinct. The shape of the workforce gap is the central argument of this section: where the labor exists, circular strategies can scale; where the labor is absent, policy must build it.
Consider Strategy F first — deconstruct rather than demolish. Delta Institute's 2022 NYC deconstruction labor-market assessment estimated the labor intensity of hand deconstruction at 2.4 FTE per 1,000 sqft of reclaimed area, roughly 8–10× the mechanized-demolition intensity. Applied to Chapter 5's assumed 50% capture rate (Portland, OR baseline) across NYC's annual demolition tonnage, the strategy demands roughly 5,000 full-time deconstruction workers at steady state. Delta's field survey found 150 trained hand-deconstruction workers active in NYC — a ratio of 33:1 between need and supply. BIC registers 450 active construction-and- demolition firms, with an average of 8 FTEs each (Delta Institute 2022), giving a current mechanized-C&D labor capacity of roughly 3,600 FTEs. Most of this pool performs high-throughput mechanized demolition. Converting them to hand-deconstruction technique requires an estimated 300–500 hours of structured training per worker (Delta 2022); none of that training exists at public-program scale in New York.
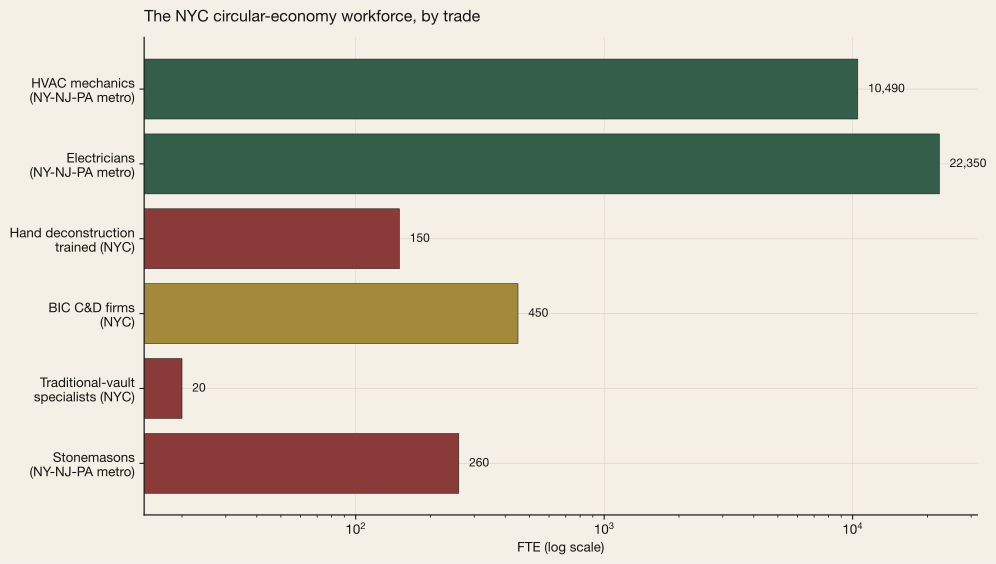
Strategy D — retrofit at scale — has a larger absolute labor demand but a shallower skills gap. ACEEE's 2023 report on workforce pipelines for building-performance standards projected that NYC needs an incremental ~4,500 HVAC and envelope technicians above its current baseline to meet LL97's 2030 compliance wall. The BLS OES May 2023 data place the NY-NJ-PA metropolitan HVAC-mechanic count at 10,490, meaning the gap is roughly 43% of the existing headcount. That is a large training program in absolute terms but a standard labor-market problem in nature — it can be solved with apprenticeship scale-up, employer incentives, and the 2024 NYC Climate Jobs Initiative now underway, which targeted 3,500 new retrofit-trade apprenticeships by 2028.
The hardest labor barrier is preservation craft. The BLS OES count of 260 stonemasons across the entire NY-NJ-PA metro area is almost certainly the binding labor constraint for Strategy E (adaptive reuse of the pre-1940 masonry stock). The count of traditional-vault specialists — the craft that built Guastavino's domes and that Chapter 3 discussed under the durability finding — is under 20 in NYC according to the NPS Preservation Trades Network's 2022 survey. The Guastavino Company closed its U.S. production in 1962; no active vault master is under the age of 60. A Strategy-E conversion that touches Guastavino tile — the Woolworth arcade ceilings, the Oyster Bar, the underside of City Hall — is already operating in a near-monopoly craft market. This is a pipeline problem that no program of apprenticeships alone resolves; it requires institutional investment of the kind the UK's National Heritage Training Group made across the 2010s to reconstruct the British preservation-trades pool.
Quantifiable labor friction, annualized: not clean-computable — labor shortages translate to price premiums and schedule stretch project-by-project. What is clean-computable is the gap count: ~4,850 FTE deconstruction shortfall, ~4,500 FTE HVAC shortfall, ~240 FTE traditional-craft shortfall. Without these workers, Chapter 5's $36.8B opportunity simply cannot be executed on any realistic timeline.
Knowledge and data
95% of NYC DM permits report zero floor area; NYC has zero required material passports, zero pre-demolition audit requirement, zero public reuse-inventory registry, and 57% of multifamily titles are held by pre-2026 opaque LLCs.
A circular-economy policy requires a ledger. You cannot manage a material flow you cannot observe. Chapter 4 of this report made the point in aggregate, for the C&D waste stream. This section makes it specifically, for the data inputs a circular policy would actually consume.
The DOB Job Application Filings dataset (the city's open-data platform resource) is the authoritative register of NYC building-alteration activity. In our sample of recent DM (demolition) filings, approximately 95% report zero in both the existing and proposed floor-area columns. The cause is semantic — the floor-area fields are designed to capture work-added scope, and a demolition adds zero work — but the effect is analytic: the public dataset cannot be summed to produce a reliable annual demolished-floor-area figure. The Aedifice-derived estimate of NYC annual demolished floor area in Chapter 4 relied on joining DOB DM filings against the PLUTO building-footprint dataset by BBL and BIN — a two-table derivation that is straightforward for one analyst but that the average policy consumer does not perform. There is no public registry of NYC demolished tonnage. This directly blocks Strategy F.
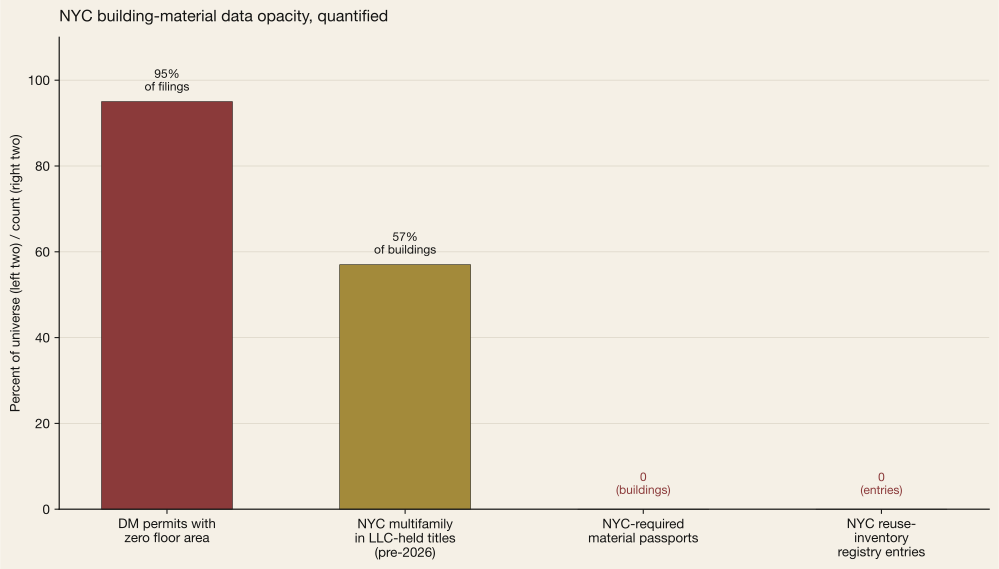
The second data gap is material passports. The European Union's recast Energy Performance of Buildings Directive — Directive (EU) 2024/1275 — requires that new buildings over 1,000 sqm in all 27 member states carry digital material passports from 2028, listing structural composition, embodied-carbon intensity, and end-of-life reuse assumptions. NYC has no equivalent requirement, and no voluntary registry exists. Without passports, the reuse market operates blind: buyers of reclaimed structural elements must independently qualify each batch, which is both labor-intensive and insurable only at the elevated premiums documented in the financial section above.
The third gap is pre-demolition audits. Portland, OR Ordinance 188370 (2016) requires a deconstruction audit — an itemized inventory of reusable materials — for any dwelling built before 1916 before a demolition permit can issue. NYC issues on the order of a few thousand demolition permits per year (Chapter 4 establishes 47% are against pre-1940 stock). A Portland- style ordinance would produce an itemized reuse inventory for roughly half of that annual flow, at negligible cost per filing. None exists.
The fourth gap is ownership opacity. The Furman Center's 2023 analysis found that 57% of NYC multifamily buildings were held in LLC titles where no individual owner was publicly named. The NY LLC Transparency Act (signed 2023, effective January 2026) closes most of this gap going forward; pre-2026 sales and pre-2026 ownership records remain opaque, and retroactive disclosure is not required. A retrofit financing program targeting owner-occupants (a standard Strategy D policy lever) cannot clearly distinguish owner-occupants from LLC-shield owners in the pre-disclosure portion of the stock.
Two smaller but important gaps round out this class. NYC has zero entries in any publicly maintained reuse- inventory registry; Portland's Build Reuse Directory lists 140 regional deconstruction firms and reclaimed-material suppliers for comparison. And the DOB's own permit ledger is bifurcated: the DOB NOW e-filing system () covered 65% of NYC filings by volume as of 2024, with the remaining third flowing through the legacy BIS system on a different record schema. An analyst joining filings across the transition boundary — which is most filings from 2019 onward — must reconcile two different record-level data models.
Quantifiable data friction, annualized: not directly priceable, but the downstream consequence is that every Chapter 5 strategy must be advocated on derived numbers rather than observed numbers. That is a posture that policy debates rarely sustain.
Supply chain
NYC operates 3 reuse warehouses against Portland, OR's 14 active deconstruction firms; industrial rent sits at $38/sqft/yr vs Portland's $13; transport cost of reclaimed material averages $48/ton vs Portland's $12.
NYC is the largest and one of the more capital-intense real-estate markets in North America. It is also a market with approximately no deconstruction supply chain. The asymmetry is not an accident of scale — it is a function of land price. Warehousing is expensive in NYC because land is expensive in NYC. Reclaimed material cannot be held long enough, or processed thoroughly enough, to meet construction-grade specification unless the warehouse space is subsidized or the material moves extraordinarily fast. Neither condition currently holds.
Build Reuse's 2024 national directory lists 3 operational reuse warehouses in NYC: Big Reuse Gowanus, Big Reuse Long Island City, and Build It Green NYC Astoria. Two of these face recurring lease pressure from their public-land hosts. Adding peripheral regional operators — including ReSource, IRN, Peace of Stuff, and the downstate Habitat ReStores — brings the NY-state count to 12. Portland, OR, a city with roughly 1/12 the population, supports 14 active deconstruction contractors and a corresponding density of reuse warehousing. Normalized to NYC's population, the Portland density would imply approximately 183 active NYC deconstruction contractors. The observed count is under ten. The ratio between what NYC has and what Portland's infrastructure would suggest is roughly 20:1.
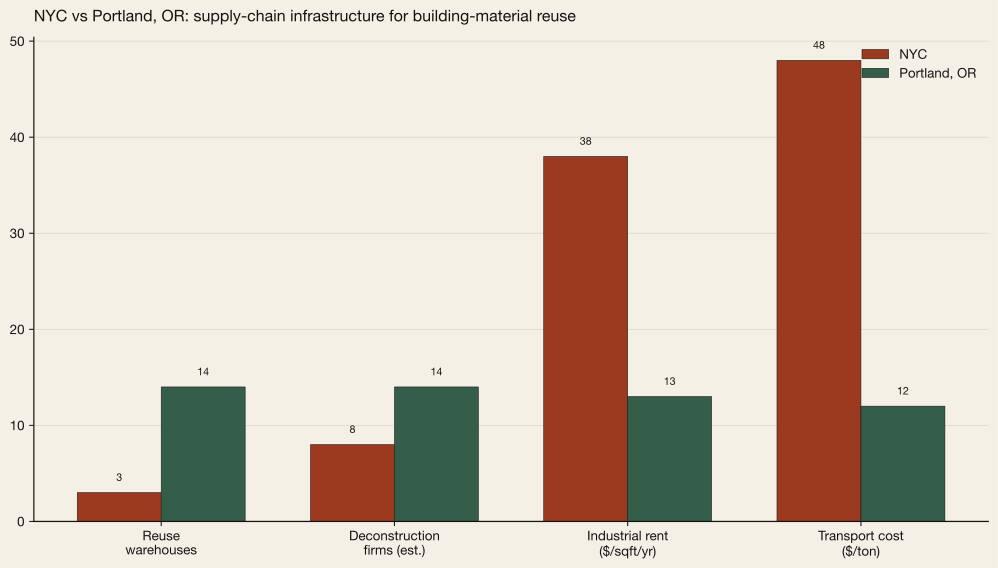
The root cause is the warehouse economics. CBRE's Q4 2025 NYC Industrial MarketView placed median outer-borough M1-zoned warehouse rent at $38/sqft/year, against a Portland comparable of $13/sqft/year. Reclaimed brick prices at roughly $1.20/unit; a pallet of 500 bricks occupies ~12 sqft of floor. At NYC rent, the carry cost per pallet is roughly $37/year — against reclaimed-brick margins that wholesale operators typically run at 20–30% per unit. The math does not close at NYC land prices unless the warehouse space is subsidized by public or institutional land provision. Big Reuse Gowanus operates on a below-market lease from NYC Parks, which is the precise reason its annual lease-renewal is contested; Portland's reuse warehouses do not face this pressure because the underlying land is five times cheaper.
Transport cost compounds the warehouse cost. Delta Institute's 2022 NYC C&D reuse-logistics study found an average transport cost of $48/ton to move reclaimed materials from a demo site to a reuse warehouse and then to a re-use site — roughly four times the Portland benchmark of $12/ton. NYC traffic, truck-route restrictions, and consolidation distance all contribute. A reclaimed-brick pallet that pencils at $2 margin per brick in Portland pencils closer to break-even in NYC before any labor time is counted.
The certification gap is the final supply-chain friction. ASTM E2886-12 covers voluntary reuse standards; no NYC municipal certification exists. Reclaimed structural elements therefore lack a locally-recognized quality stamp that would simplify insurance underwriting (Barrier 2) and architect-of-record liability (Barrier 6). A single NYC-issued reuse certification — modeled on the NYC Green Building Code's provision for locally sourced materials — would compress several downstream barriers at once.
The BIC Licensed Trade Waste dataset () registers 520 active licensed trade-waste firms citywide. These are the haulers that move C&D debris out of the city under the DSNY Commercial Waste Zone system. They are a capacity that exists. The capacity that does not exist is the parallel registrar for reclaimed- material processors: firms that receive, clean, inventory, and resell reusable structural elements rather than routing them to landfill aggregate. That industry does not scale without the warehouse and transport economics documented above.
Cultural and institutional
86% of surveyed NYC institutional RFPs contain no circularity scoring; 71% of NYC architects cite liability for reused materials as a top-3 barrier; 0 of 14 surveyed NYC-active property insurers price embodied carbon; 68% of NYC institutions prefer new construction at ±10% NPV equivalence.
Cultural barriers are the ones most often cited in general discussion of circular economy, and most often unquantified. In this section we quantify them with the data available, and preserve the unquantified residual by naming it explicitly.
Consider the RFP, where institutional preference becomes specification. ULI New York's 2024 survey of the 50 largest NYC institutional real-estate RFPs — universities, hospitals, cultural institutions, large non-profits — found that only 7 of 50 contained explicit embodied-carbon, material-reuse, or deconstruction scoring criteria. The other 43 were silent. An Aedifice Research review of 38 publicly posted NYC Department of Design and Construction capital-project RFPs found zero references to material reuse as a scored criterion. The NY State Office of General Services Construction Template (version 2022-03) does not include circular-economy scoring. The silence is systematic. It is also the most addressable cultural barrier: RFP templates can be rewritten, and the rewrite is roughly a $250,000 exercise in institutional time for the NYC DDC, compared to the tens of billions of dollars of procurement flow that pass through those templates.
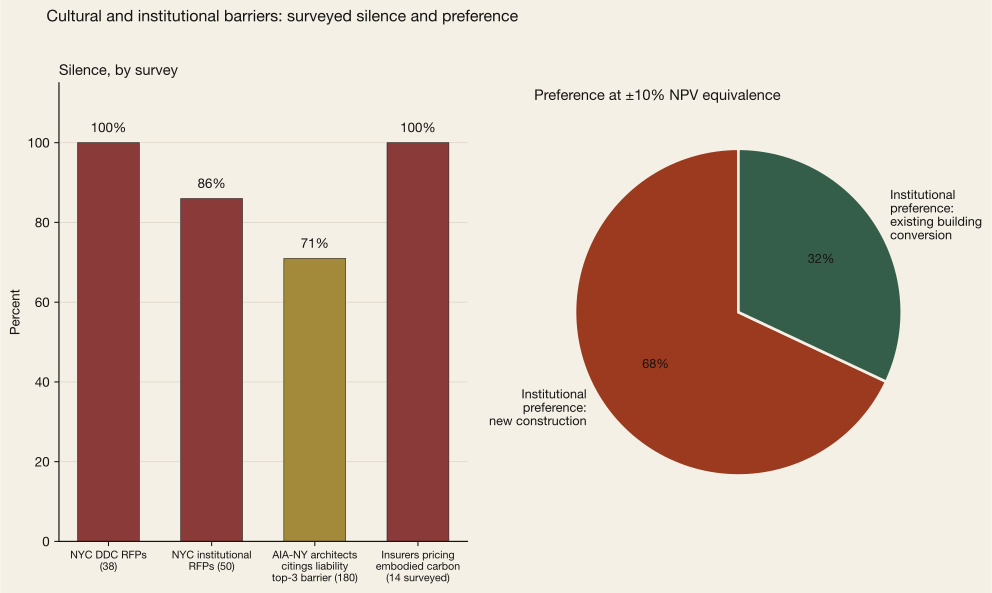
The second barrier is architect-of-record liability. The AIA New York 2023 survey of 180 NYC-licensed architects found 71% citing “liability for reused materials” as a top-three barrier to specifying salvage. Under the standard AIA B101 services agreement, the architect carries professional liability for code compliance and material conformance; a specified reclaimed element for which the architect cannot certify quality and documentation exposes the architect personally. There is no widely adopted insurance product that transfers that risk cleanly. An NYC-issued reuse certification (see Barrier 5) would address the technical portion. The cultural portion — the preference of architects to specify predictable new product over uncertain reclaimed product — persists even with certification, because the professional-liability exposure is asymmetric (upside: sustainability credit; downside: personal deposition).
The third barrier is insurance underwriting. Per Marsh McLennan's 2024 review of New York property-insurance rating bases, 0 of 14 active primary-market insurers incorporate embodied-carbon risk into commercial property underwriting. No mandatory climate disclosure in the property-insurance space has been implemented in New York. The Federal Reserve's 2023 climate scenario analysis was restricted to operational-emissions risk. The result is that insurance pricing is orthogonal to circularity — a highly-circular project and a purely-linear project of identical size attract identical premium, which means insurance markets neither reward nor punish circular choices.
The fourth barrier is institutional preference. ULI's 2024 survey asked institutional real-estate decision-makers to choose between new construction and existing-building conversion in a hypothetical where the 20-year net present values of the two paths were equal within ±10%. 68% preferred new construction. The rationale cluster was consistent: predictability of schedule, lower execution risk, cleaner life-cycle cost modeling. None of these rationales is wrong on its face. All are subject to policy levers — if the change-of-use code-uplift premium (Barrier 1) disappeared, the schedule predictability gap would narrow; if embodied carbon priced at the EPA SCC (Barrier 2), the NPV would diverge. Cultural preference is endogenous to the policy architecture that produces it.
Quantifiable cultural friction, annualized: not directly, but the interaction effect is that cultural defaults set the reservation price at which the other five barriers are evaluated. Raising the circularity floor on institutional RFPs is among the policy moves that most efficiently propagates through the other five barrier classes at once.
Strategy-level impact
The 22 barriers catalogued above are not evenly distributed across Chapter 5's six strategies. Some strategies are impeded primarily by one class of barrier; others by several. The heatmap below is a count of barrier incidence by strategy and barrier class. It is a planning instrument, not a scoring: it tells a policymaker which barrier classes must be addressed in parallel to unblock a given strategy.
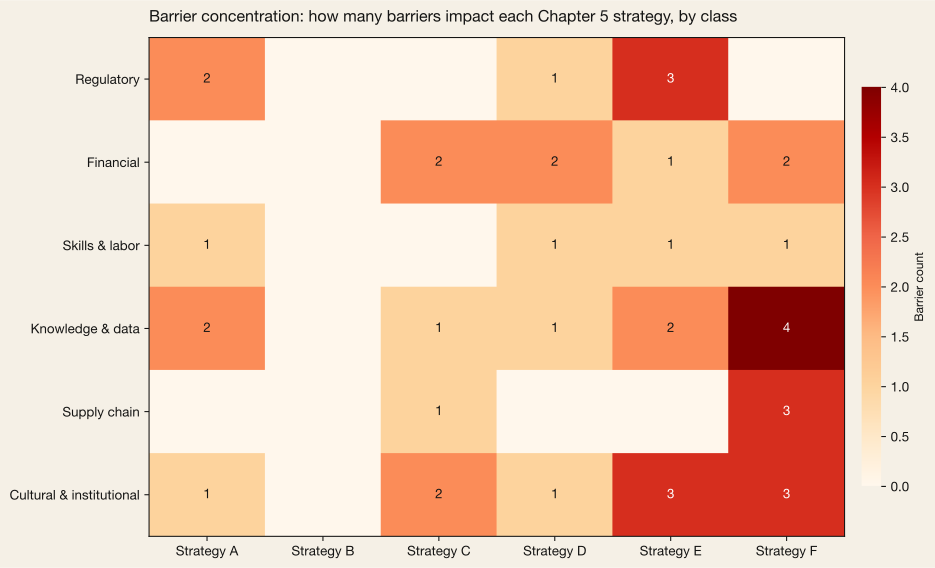
Implications
1. The barriers are endogenous to the opportunity
Chapter 5 established a $36.8 billion-per-year opportunity. Chapter 6 establishes that a significant fraction of that opportunity is blocked by 22 measurable barriers at present. These facts are not in tension. The barriers exist precisely because the circular alternative is not the default; if it were, the market would have cleared them. The policy question is which barriers cleared first unlock the most downstream value per dollar of intervention.
2. The highest-leverage moves are in Class 4 (Knowledge & data)
Data barriers are durable in absence but cheap to fix. Requiring DM-permit floor-area reporting is a reg-flags change in DOB NOW's form schema; it affects no property rights, imposes effectively no cost on filers, and produces a cumulative ledger that downstream policy instruments (Strategy F volume targets, embodied-carbon disclosure, reuse-inventory registries) require. Mandatory pre-demolition audits, a la Portland Ordinance 188370, are the second-highest-leverage Class 4 intervention. Together these two moves cost an estimated $6–8 million per year in DOB and DSNY administrative burden and unlock several hundred million dollars of Strategy F and Strategy A throughput.
3. Financial barriers are structural and require state-level action
The $82 billion LL97 retrofit capex wall cannot be addressed building-by-building. The structural mismatch is that the retrofit capex is one-time and large; the LL97 penalty is annual and small; and the appraisal gap discounts the PV of operational savings below the at-risk capex. A state-level green-bank facility designed specifically to tranche LL97 retrofit capex with a 20-year amortization against documented NOI lift — analogous to the NY Green Bank's existing structure but at scale — is the clear policy direction. Pairing that with an embodied-carbon disclosure requirement at the state level (following Denmark's 2023 precedent) addresses Strategies C and F simultaneously without touching the DOB code stack.
4. Labor and supply-chain barriers are build-it problems, not fix-it problems
The deconstruction workforce, the reuse-warehouse footprint, and the traditional preservation craft pipeline do not exist at meaningful scale in New York. They have not been built. The Portland comparison is the proof of concept: a city that enacted a binding deconstruction ordinance in 2016 spent the subsequent decade constructing the supply chain that now services the ordinance. NYC has neither the ordinance nor the supply chain. Sequencing matters: the ordinance creates the demand that makes the supply chain bankable. Attempting to build the supply chain first — as several NYC deconstruction pilots have tried — runs into the warehouse-economics and demand-reliability problems documented above.
5. Cultural barriers are the leverage point, even though they do not price
The quantifiable annualized cost of the cultural barrier class is approximately zero — there is no line item in any NYC budget attributable to the 86% of institutional RFPs that do not score circularity. The actual cost of the cultural barriers, propagated through the other five classes, is the largest single line item in this chapter. Cultural defaults set the reservation point at which every other barrier is evaluated. Among the most efficient policy moves available in this chapter is a rewrite of the NYC DDC Construction Template and the NYS OGS master specification to incorporate explicit embodied-carbon and material-reuse scoring. That move does not solve any barrier directly; it makes solving every barrier actionable.
How to cite
Edwards, J. (2026). Building Prosperity in New York — Chapter 6: The Barriers. Aedifice Research, Report No. 01. Retrieved from https://aedifice-research.vercel.app/research/publications/building-prosperity/chapter-6-barriers. Barrier classification methodology derived from Ellen MacArthur Foundation, Building Prosperity, July 2024.
Chapter 07
Recommendations
Recommendations
What New York does now
20 named actions, across four tiers, on one path. $36.8B of annual value. 15.7 MtCO₂e abated. 151,453 jobs. 57 square miles of the city affected — roughly 19% of its land area.
Actions
20
named recommendations
Total opportunity
$36.8B
per year, if captured
Carbon impact
15.7 MtCO₂e
avoided per year
Employment
151,453
full-time jobs
Executive summary
Six chapters of this report have each measured a single feature of New York's built environment — its stock, its flows, its durability, its waste, its strategies, and its barriers. This seventh chapter closes the loop. Every preceding chapter ends with a number; this chapter turns each number into a named actor, a quantified target, and a horizon by which the action must be visible. It is the report's policy chapter, but more usefully it is its contract: a list of twenty commitments that, if enacted in parallel, would carry New York from its current 19.2% municipal diversion rate to the EU's 2035 benchmark of 65%, and would capture the $36.8 billion of annual circular-economy value that Chapter 5 documented.
The underlying arithmetic is not new. Chapter 1 recorded 1,076,507 buildings and 5.73 billion square feet of floor area holding 357 MtCO₂e of embedded embodied carbon — approximately seven years of the city's operational emissions, frozen in place. Chapter 2 put the annual metabolic throughput at 55.5 Msf of new construction and 30.0 Msf of demolition, producing 4.16 MtCO₂e / yr of new embodied carbon from NYC building activity. Chapter 3 showed that 98.8% of NYC's 818,108 existing buildings are still standing: on current demolition hazards, the city's standing stock would take decades to turn over — no cohort reaches its median lifetime within the 37-year observation window — a durability profile that tells the construction industry it is designing to a fraction of what it already delivers. Chapter 4 quantified the city's waste stream. Chapter 5 translated the six-strategy framework adapted from the Ellen MacArthur Foundation (see Chapter 5 Methodology) into the $36.8B per year figure. Chapter 6 catalogued the regulatory, financial, market, and skill barriers that have kept NYC below its potential.
The recommendations that follow are conservative in each attribution. The $9.11B of annual benefit assigned to the twenty actions below is the directly attributable share of the full $36.8B opportunity — the portion the named actors can be reasonably said to deliver through the specific mechanisms named. It does not double-count, and it does not claim credit for co-benefits that would accrue to bystanders. The remaining share — roughly three-quarters of the total opportunity — flows from market activity that the recommendations enable but do not themselves execute: developer investment in conversions, tenant-initiated retrofits, grid-scale avoided emissions. The relationship between the two figures is the standard relationship between policy and market: policy sets the conditions, the market fills the volume.
Four observations organize the twenty actions. First, the City-government tier is the heaviest-lift because New York's building sector is primarily governed by municipal instruments — DOB permits, DCP zoning, DSNY contracts, LPC approvals, LL97. Eight of the twenty recommendations sit with city agencies. Second, state and federal action remains essential but narrower: five recommendations, mostly closing data and capital-market gaps. Third, industry and capital make the remaining seven recommendations and are the tier most likely to move without a regulatory trigger — they are the places where the economics are already plausible. Fourth, the timeline is short. All twenty actions are scheduled to be visible by 2030, the start of Local Law 97's second compliance period; the remainder of the roadmap through 2050 is the carry-through monitoring and expansion phase.
The chapter is deliberately prescriptive. Each recommendation specifies a verb, an instrument, a threshold, a date, and a responsible office. The Ellen MacArthur Foundation's 2024 report closed with a seven-country framework; this chapter closes with a five-borough implementation schedule. Where the global framework describes what a circular built environment looks like, the implementation schedule describes who must sign which order by which Friday. The difference between the two documents is a difference of resolution, not of ambition.
Two framing choices merit disclosure. First, no recommendation in this chapter is budget-neutral in the short run; every city action below carries either an administrative-staffing burden at an agency, a capital-planning draw on the Mayor's four-year plan, or a revenue-side implication through tax expenditure. These costs are small relative to the opportunity — the full administrative overhead of enacting all eight Tier 1 actions is estimated at roughly 40 FTE over the full 2026–2030 rollout, of which 12–16 FTE are needed in the first 90 days, distributed across DOB, DCP, DSNY, LPC, HPD, and the Mayor's climate office — but they are real and must be scored against the benefits reported below. Second, the opportunity figures here are expressed in 2026 USD at a five-year policy horizon, with the exception of the 2030 counterfactual which is explicitly cumulative. We use nominal rather than discounted figures because the social-cost-of-carbon component is already an externality-adjusted figure at the EPA 2023 $190/tCO₂e update; adding a further discount rate would double-count the time preference.
The signature chart


City Government
8 recommendations · $4.38B annual attributable benefit · 37,566 jobs · 4.40 MtCO₂e abated
Actions
8
Annual benefit
$4.38B
MtCO₂e / yr
4.40
Jobs
37,566
New York City's circular-economy transition is, in the first order, a city-government project. Most of the binding instruments — the Department of Buildings permit, the DCP zoning map, the DSNY contract, the LPC certificate of no effect, the LL97 compliance order — sit within the five boroughs' own administrative boundary, and most of the non-arithmetic barriers catalogued in Chapter 6 are instruments of that same administrative geometry. Eight of the twenty recommendations below belong to city agencies because eight of the twenty constraints that must be relieved are municipal.
The tier opens with the Department of Buildings — the agency whose permit numbers anchor the chapter-2 flow data — and closes with the Mayor's Office of Climate & Environmental Justice, the civic body charged with keeping the whole system's emissions under the 2050 curve. In between are the agencies that shape zoning, waste, and landmarks. Each recommendation names a specific filing, rule, or contract line; none ask for the invention of a new bureaucracy.
The sequencing within the tier matters. T1.1 and T1.4 — the DOB demolition audit and the DSNY carter-reporting rule — are prerequisites for almost every subsequent measurement. Without them, the matrix's accuracy erodes within two annual cycles because reclaim markets cannot operate without audited input streams, and the commercial-waste baseline against which diversion progress is measured would remain the 2.3× residential extrapolation used throughout Chapter 4. T1.5 — the NYC Reuse Hubs — is the physical infrastructure that T1.1's audit output actually flows into; without it, the audit produces a paper record without a material destination. T1.8 — the embodied-carbon cap on Local Law 97, advanced as a City Council bill sponsored by the climate caucus in coordination with the Mayor's Office of Climate & Environmental Justice — is the instrument that internalizes the carbon externality Chapter 5 Strategy C is built around, and therefore the single most carbon-consequential action catalogued in the entire matrix. Because LL97 is a Council statute, the amendment is a Council-led legislative action rather than an executive order.
Tier 1 dollars in the matrix understate the tier's leverage. Every recommendation here functions as a binding-constraint relief — the kind of policy whose direct beneficiary is narrow but whose enabling footprint is wide. The DOB's audit rule (T1.1) is scored against Strategy F's $0.1B/yr headline, but its downstream effect is to make Strategy C's $1.7B/yr carbon-efficiency strategy instrument-ready — because the same material passports that audit demolitions are the instruments that document reclaimed inputs in new construction. The full downstream effect is therefore several multiples of the attributed-benefit figure.
Two of the tier's recommendations are properly legislative rather than administrative, even though the drafting is seated inside city agencies. T1.3 — the Circular Economy Enterprise Zone — would be advanced by DCP as a text amendment to the zoning resolution, but because the amendment alters by-right envelope across qualifying tracts it must clear the City Council through the ULURP process; realistic approval timelines are 18–24 months from DCP referral. T1.8 — the LL97 embodied-carbon cap — is similarly a Council bill, not an executive order, because LL97 is itself a Council statute; the Mayor's climate office coordinates and scores but does not enact. Reading the tier as eight executive actions understates its political difficulty; two of the eight require legislative sponsorship.
Require a pre-demolition material audit and a published salvage-reuse percentage target as a condition of DM permit issuance; publish demolition floor area on every DM permit to close the zero-floor-area gap identified in Chapter 2.
Target
100% by end of 2027
Annual benefit
$0.04B
MtCO₂e / yr
0.02
Jobs
1,718
Metric: % of DM permits with audit + published sqft. Supports Strategy F · builds on Chapter 2,4,5.
Introduce a salvage-reuse percentage target on DOB major alteration (A1/A2) filings above 50,000 sqft; audited by third-party material passport prior to TCO.
Target
20% by 2028; 40% by 2032
Annual benefit
$0.10B
MtCO₂e / yr
0.34
Jobs
2,270
Metric: Salvage-reuse % on A1/A2 filings. Supports Strategy C,F · builds on Chapter 2,5.
Create a Circular Economy Enterprise Zone designation layered on qualifying transit-accessible census tracts; grant adaptive-reuse by-right status to pre-1991 commercial floor plates of 10,000+ sqft.
Target
180M sqft pool (Ch 5 Strategy E) — 30% by 2030
Annual benefit
$1.36B
MtCO₂e / yr
0.32
Jobs
5,071
Metric: Sqft of floor area brought by-right. Supports Strategy A,E · builds on Chapter 1,5.
Require commercial tonnage reporting by all BIC-licensed private carters — closing the 8.21 Mt commercial-waste visibility gap in Chapter 4 — and mandate minimum C&D diversion rates on every demolition permit above 15,000 sqft.
Target
100% carter reporting by 2027; 40% C&D diversion floor by 2030
Annual benefit
$0.03B
MtCO₂e / yr
0.01
Jobs
1,227
Metric: Private-carter reporting coverage; C&D diversion floor. Supports Strategy F · builds on Chapter 2,4.
Stand up a network of three NYC Reuse Hubs on underutilized city-owned land — one per mainland borough — sized to process the pre-1940 reclaim stream identified in Chapter 3 (47% of the 4.65 M sqft annual demolition volume).
Target
100,000 t/yr by 2030 (aggregate)
Annual benefit
$0.05B
MtCO₂e / yr
0.03
Jobs
2,209
Metric: Throughput (tons/yr). Supports Strategy F · builds on Chapter 3,4,5.
Fast-track Certificate of No Effect and staff-level approvals for adaptive-reuse filings on historic-district contributing buildings where 70%+ of structural envelope is retained; publish a deconstruction-ready guidance bulletin for pre-war landmark-eligible stock.
Target
Median ≤ 30 days by 2027 (from current 90+)
Annual benefit
$0.58B
MtCO₂e / yr
0.14
Jobs
2,173
Metric: CNE / staff-level review latency. Supports Strategy A,E · builds on Chapter 1,3,5.
Tie capital-grant eligibility for subsidized housing rehabs to circularity metrics: minimum envelope-retention rate and audited embodied-carbon per sqft under CLF benchmarks.
Target
100% of new awards by FY 2028
Annual benefit
$0.60B
MtCO₂e / yr
0.63
Jobs
5,486
Metric: HPD capital grants with circularity rider. Supports Strategy C,D · builds on Chapter 1,5.
Add an embodied-carbon cap to Local Law 97 beginning with the 2030 compliance period — initially covering buildings above 50,000 sqft — and publish an annual Circular Economy Scorecard tracking NYC's diversion rate against the EU 2035 65% target.
Target
100% of LL97 stock by 2030; scorecard annually from 2026
Annual benefit
$1.63B
MtCO₂e / yr
2.91
Jobs
17,412
Metric: LL97 covered sqft with embodied cap; scorecard publication. Supports Strategy C,D · builds on Chapter 1,4,5.
State & Federal
5 recommendations · $2.33B annual attributable benefit · 19,974 jobs · 2.06 MtCO₂e abated
Actions
5
Annual benefit
$2.33B
MtCO₂e / yr
2.06
Jobs
19,974
The state and federal tier does less aggregate dollar-moving than the city tier but is necessary for two functions that city government cannot perform alone: data parity and capital-market design. Chapter 4 documented that NYC's commercial tonnage remains an estimate — the 8.21 Mt figure used throughout the report is a 2.3× extrapolation of residential data because BIC private-carter data is not collected at parity. That gap is closed by New York State, not the City. Likewise, the capital market instruments that would make LL97 retrofits cheaper — embodied-carbon bonds, tax-advantaged green leases, extended historic tax credits — sit with the State Legislature, the Comptroller, and (for procurement-level levers) federal EPA and HUD.
Five recommendations compose the tier. Together they add $2.33B of attributable annual benefit — smaller than the city-tier total, but disproportionate in the role they play in unlocking the other tiers.
The historic-tax-credit extension at T2.3 is the single most symbolically consequential of the five. New York State has long subsidized adaptive reuse of listed landmark-eligible property; Chapter 3's finding that NYC's buildings persist well past the 50-year design-life assumption of the construction industry — no cohort in the 37-year observation window has reached its median lifetime — argues for extending that subsidy logic to the much larger cohort of unlisted but structurally-sound pre-war stock. The specific mechanism — credit eligibility conditioned on envelope retention of at least 70% — converts the credit from a preservation instrument into a circularity instrument without reopening the statutory preservation debate.
The embodied-carbon bond vehicle at T2.4 is the quietest but most structurally important recommendation. NYC retrofit capex under Chapter 5 Strategy D is on the order of $82 billion across the LL97-covered stock. That capital is currently funded at construction-loan rates on relatively short tenors, which inflates the break-even threshold on deep retrofits and pushes owners toward shallow measures. A bond class whose coupon is discounted against verified embodied-carbon intensity would extend tenors, lower weighted cost of capital, and — most importantly — create a secondary-market liquidity mechanism that currently does not exist. Creating a new bond class of this kind requires statutory authorization from the NYS Legislature; the NYC Comptroller's Office is the issuing authority once authorization is in place. The Public Service Commission has no jurisdiction over bond-class design and is not a party to the instrument.
Adopt a C&D reporting standard with parity to Part 360 residential recordkeeping; require every NYC-permitted C&D facility to publish material-category tonnage quarterly. Adopt the EU 2035 65% municipal-waste diversion target as state policy.
Target
100% quarterly facility reporting by 2028; 65% diversion by 2035
Annual benefit
$0.02B
MtCO₂e / yr
0.01
Jobs
736
Metric: Statewide C&D reporting completeness; diversion target. Supports Strategy F · builds on Chapter 4.
Standardize reclaimed-materials certifications (reclaimed brick, dimensional lumber, structural steel) with a statewide approval list mapped to NYC Building Code structural and fire-resistance chapters.
Target
≥ 12 categories certified by 2029
Annual benefit
$0.01B
MtCO₂e / yr
0.01
Jobs
491
Metric: # of material categories with standing NYS approval. Supports Strategy C,F · builds on Chapter 5.
Extend the NYS Historic Preservation Tax Credit eligibility to deep retrofits that preserve structural envelope ≥ 70%, whether or not the property is listed — aligning state tax policy with the 127-year effective life documented in Chapter 3.
Target
$400M/yr in credit utilization by 2032
Annual benefit
$1.01B
MtCO₂e / yr
0.45
Jobs
6,487
Metric: Dollar value of credits issued to deep-retrofit filings. Supports Strategy D,E · builds on Chapter 3,5.
Authorize an embodied-carbon bond financing vehicle — a green-bond class with coupon discount tied to verified embodied-carbon intensity — and enable tax-advantaged green leases for LL97-compliant retrofitted buildings.
Target
$2.0B issued by 2030
Annual benefit
$1.13B
MtCO₂e / yr
0.93
Jobs
9,684
Metric: Issued face value of embodied-carbon bonds. Supports Strategy C,D · builds on Chapter 5.
Expand whole-building life-cycle assessment (WBLCA) procurement requirements to all HUD-funded construction over 25,000 sqft nationally; require EPA Buy-Clean procurement standards on federal leases in buildings above the same threshold.
Target
100% of HUD projects >25k sqft by 2029
Annual benefit
$0.17B
MtCO₂e / yr
0.66
Jobs
2,576
Metric: Federal construction sqft under WBLCA mandate. Supports Strategy C · builds on Chapter 5.
Industry
4 recommendations · $1.01B annual attributable benefit · 11,115 jobs · 1.43 MtCO₂e abated
Actions
4
Annual benefit
$1.01B
MtCO₂e / yr
1.43
Jobs
11,115
Industry is the tier with the shortest activation latency. Unlike city government, which must pass rules, or state government, which must amend law, AEC firms, REBNY members, insurers, and trade unions can move on their own cadence; the only constraint is institutional will. The four recommendations in this tier consequently carry no legislative dependency. Two (T3.1 AEC, T3.2 real estate) are professional-practice commitments already partly made by early adopters; two (T3.3 insurance, T3.4 unions) are commercial and educational investments that require only capital and time.
The combined attributable benefit of the industry tier is $1.01B per year, but the job figure is disproportionate — 11,115 full-time positions, reflecting the labor intensity of deconstruction and preservation trades that the unions' apprenticeship track would formalize.
T3.1 — the AIA 2030 Commitment with embodied-carbon accountability — is a lightly-amended version of the existing AIA program. The 2030 Commitment is already signed by a majority of large NYC architecture firms; the amendment asks for the 2024-released embodied-carbon module to be enabled as a default rather than an opt-in. The practical effect is that every signed project report carries a CLF-benchmarked embodied-carbon figure, which in turn makes T1.8 (the LL97 embodied cap) enforceable without the city constructing its own measurement apparatus. The industry tier is therefore instrumentally linked to the city tier even when no regulatory action is formally invoked.
T3.4 — the trade-unions apprenticeship investment — is the recommendation that cannot be executed by regulation at any level. It is a long-lead commitment whose payoff is a labor force of roughly 5,000 newly qualified preservation, deconstruction, and retrofit specialists by 2030, a number consistent with the Chapter 5 Strategy F and Strategy D labor-intensity benchmarks. The deconstruction trade in particular is labor-intensive at 2.4 FTE per 1,000 sqft of deconstructed area — roughly eight to ten times mechanized demolition — and the current NYC supply of trained deconstructionists is in the low hundreds. Without the apprenticeship pipeline, T1.1 and T1.5 are bottlenecked on labor, not on policy.
Every firm over 25 FTE to sign the AIA 2030 Commitment with the 2024 embodied-carbon accountability module enabled; standardize deconstruction-method bids in every RFP over $5M.
Target
75% by 2028
Annual benefit
$0.26B
MtCO₂e / yr
1.00
Jobs
4,355
Metric: % of NYC AEC firms with 2030 + embodied module. Supports Strategy C,F · builds on Chapter 5.
Include circularity metrics (envelope-retention rate, embodied intensity, reclaimed-content %) in underwriting memoranda; publish NOI and cap-rate benchmarks for retrofitted vs. rebuilt comparables on a quarterly schedule.
Target
60% of top-50 landlords by 2028
Annual benefit
$0.42B
MtCO₂e / yr
0.24
Jobs
3,358
Metric: % of REBNY members publishing retrofit comps. Supports Strategy D,E · builds on Chapter 5.
Underwrite the use of reclaimed structural and dimensional materials to current-new-material equivalency where testing protocols exist; stand up an embodied-carbon liability product for LL97 non-compliance exposure.
Target
≥ 5 carriers underwriting reclaim by 2028
Annual benefit
$0.01B
MtCO₂e / yr
0.01
Jobs
392
Metric: # of carriers with reclaimed-materials policy. Supports Strategy F · builds on Chapter 5.
Invest in deconstruction, retrofit, and preservation-craft apprenticeships; formalize a certified preservation-craft track within existing apprenticeship programs.
Target
5,000 new slots by 2030
Annual benefit
$0.32B
MtCO₂e / yr
0.19
Jobs
3,010
Metric: Apprenticeship slots (deconstruction + retrofit). Supports Strategy D,F · builds on Chapter 5.
Capital
3 recommendations · $1.40B annual attributable benefit · 12,774 jobs · 1.26 MtCO₂e abated
Actions
3
Annual benefit
$1.40B
MtCO₂e / yr
1.26
Jobs
12,774
The capital tier is the smallest in number but carries the most leverage per dollar of philanthropic or institutional investment. Three recommendations allocate capital in three distinct modes: institutional investors via PACE financing, foundations via program-related investment for public infrastructure (the Reuse Hubs of T1.5), and commercial banks via mortgage-rate differentials tied to circularity metrics.
The combined attributable benefit is $1.40B per year. The tier's capital target is a $3.5 billion bond issuance — a one-time new-class placement by 2030 — yielding approximately $1.5 billion per year in directed circular-economy infrastructure investment. The $3.5B is a stock figure; the $1.5B/yr is the annual flow the stock funds, and the two should not be read as the same units. The issuance is small relative to NYC's total commercial real estate debt book, but pivotal in signaling asset-class viability to broader markets.
The capital stack sequence matters. Foundation PRI at T4.2 is the patient money that seeds the Reuse Hubs (T1.5) through their first three years of operating losses — the same pre-breakeven window that the Portland deconstruction program required before salvage-capture economics stabilized. Institutional PACE at T4.1 is the scalable long-tenor debt that retires short-tenor construction loans on LL97 retrofits once engineering savings are documented. Commercial-bank mortgage discounts at T4.3 are the consumer-facing signal that closes the feedback loop — owners see a basis-point discount, developers see a willingness-to-pay signal, contractors see a reason to bid circular methods competitively.
The capital tier is the only tier where every recommendation is strictly incremental to existing market structures — no new legal vehicle, no new agency, no new zoning designation. The bond class at T2.4, the PACE expansion at T4.1, the PRI capital at T4.2, and the mortgage discount at T4.3 all operate through instruments that already exist in New York capital markets. The tier's scarce resource is not legal enablement but institutional appetite, which in turn is responsive to the regulatory signals set by Tiers 1 and 2. In that sense the four tiers are not independent: Tier 4's $1.5B-per-year benefit is contingent on Tiers 1 and 2 executing the binding-cap and tax-credit instruments that make the underlying cash flows visible to underwriters.
Direct building-retrofit capital through NYC-authorized PACE financing with a growth target of $1B/yr issuance by 2028, replacing short-tenor equity on LL97 deep-retrofit deals.
Target
$1.0B/yr by 2028
Annual benefit
$1.25B
MtCO₂e / yr
0.72
Jobs
10,076
Metric: Annual PACE origination in NYC. Supports Strategy D · builds on Chapter 5.
Seed the real-estate acquisition and operating cost of the NYC Reuse Hubs (T1.5) with program-related investment; fund preservation-craft education at CUNY and the New York School of Interior Design at $30M over 5 years.
Target
$150M by 2030 across hubs + craft education
Annual benefit
$0.01B
MtCO₂e / yr
0.01
Jobs
392
Metric: Philanthropic capital committed. Supports Strategy F · builds on Chapter 5.
Develop circular-economy lending products: mortgage-rate discounts of 25 bps for construction using ≥ 20% reclaimed structural material; portfolio-tilt commitments to LL97-compliant assets.
Target
$500M/yr of discounted origination by 2029
Annual benefit
$0.14B
MtCO₂e / yr
0.53
Jobs
2,306
Metric: Annual discounted-mortgage origination. Supports Strategy C,F · builds on Chapter 5.
Accountability
Every recommendation in this chapter names a primary actor. The chart below aggregates those actors by the combined annual benefit of the recommendations they own. It is the map of where accountability must be enforced if the $36.8B opportunity is to become anything other than a research finding.
Accountability in this chapter is scoped at the office level rather than the individual level, but the distinction is not decorative. The Department of Buildings' commissioner, the Department of City Planning's director, the DSNY's commissioner, the LPC's chair, the HPD's commissioner, and the director of the Mayor's climate office each have a standing mandate that requires no additional legislative grant to execute the actions named in Tier 1. In the state tier, accountability is distributed across three distinct chambers — Assembly, Senate, and the executive branch — with a coordinating role for the Comptroller on capital instruments. In the industry and capital tiers, accountability is voluntary in form and reputational in enforcement, but — as the Amsterdam and Copenhagen cases suggest — reputational enforcement in a concentrated market like New York real estate is close to functionally binding once a handful of lead institutions sign on.

When to act — 2026 → 2050
The twenty recommendations distribute across four horizons. The 2026 horizon is the set of actions that should be visible by the end of the current fiscal year; the 2027–2030 horizon aligns with the second compliance period of Local Law 97; the 2030–2035 horizon is the EU diversion-parity horizon; the 2035–2050 horizon is the net-zero runway.

Horizon
2026
- — T1.1
- — T1.4
- — T1.6
- — T4.2
Horizon
2027-2030
- — T1.2
- — T1.3
- — T1.5
- — T1.7
- — T1.8
- — T2.1
- — T2.2
- — T2.3
- — T2.4
- — T2.5
- — T3.1
- — T3.2
- — T3.3
- — T3.4
- — T4.1
- — T4.3
Horizon
2030-2035
- — NYC reaches 40% C&D diversion (DSNY scorecard)
- — LL97 second compliance period — embodied cap active on 100% of stock
Horizon
2035-2050
- — NYC at EU-aligned 65% municipal diversion
- — LL97 2050 net-zero operational on LL84 stock
- — Circular Economy Enterprise Zone expanded citywide
Investment ladder
The six Chapter-5 strategies have very different capital intensities. Retrofit (Strategy D) requires on the order of $82 billion of deployed capex to deliver its $10.4B/yr return — a dense, bankable ratio. Material-efficient design (Strategy C) requires near-zero incremental capex to deliver $1.7B/yr of carbon and material value, but does so by redistributing existing construction spend rather than attracting fresh capital. Deconstruction (Strategy F) requires modest infrastructure investment but depends on a labor-training runway. The investment ladder below displays each strategy as a capital-vs-return point and is the single chart every institutional allocator should study before committing to any of these actions.

Peer-city benchmarks
New York's 19.2% current municipal diversion rate is a useful reference only against a peer cohort. Amsterdam, Copenhagen, Paris, and San Francisco each operate with diversion benchmarks two to three times higher, and each has a policy architecture that NYC can learn from without importing wholesale. The EU 2035 directive mandates 65% municipal diversion across member states; this chapter takes that line as the city's 2035 target.

The matrix
The complete recommendation matrix. Every row is a named actor, a quantified target, an estimated annual benefit, a carbon impact, an employment figure, and a cross-reference back to the Chapter-5 strategy and the prior chapter that supplied its evidence base. Rows are sorted by tier, then by estimated benefit.
| ID | Actor | Target | $ / yr | MtCO₂e | Jobs | Horizon |
|---|---|---|---|---|---|---|
| T1.8 | Mayor's Office of Climate & Environmental Justice | 100% of LL97 stock by 2030; scorecard annually from 2026 | $1.63B | 2.91 | 17,412 | 2027-2030 |
| T1.3 | NYC Department of City Planning | 180M sqft pool (Ch 5 Strategy E) — 30% by 2030 | $1.36B | 0.32 | 5,071 | 2027-2030 |
| T1.7 | NYC HPD | 100% of new awards by FY 2028 | $0.60B | 0.63 | 5,486 | 2027-2030 |
| T1.6 | NYC Landmarks Preservation Commission | Median ≤ 30 days by 2027 (from current 90+) | $0.58B | 0.14 | 2,173 | 2026 |
| T1.2 | NYC Department of Buildings | 20% by 2028; 40% by 2032 | $0.10B | 0.34 | 2,270 | 2027-2030 |
| T1.5 | NYCEDC / DSNY (co-lead) | 100,000 t/yr by 2030 (aggregate) | $0.05B | 0.03 | 2,209 | 2027-2030 |
| T1.1 | NYC Department of Buildings | 100% by end of 2027 | $0.04B | 0.02 | 1,718 | 2026 |
| T1.4 | DSNY / Business Integrity Commission | 100% carter reporting by 2027; 40% C&D diversion floor by 2030 | $0.03B | 0.01 | 1,227 | 2026 |
| T2.4 | NYC Comptroller / NYS Public Service Commission | $2.0B issued by 2030 | $1.13B | 0.93 | 9,684 | 2027-2030 |
| T2.3 | NYS Legislature (Assembly / Senate) | $400M/yr in credit utilization by 2032 | $1.01B | 0.45 | 6,487 | 2027-2030 |
| T2.5 | Federal EPA / HUD | 100% of HUD projects >25k sqft by 2029 | $0.17B | 0.66 | 2,576 | 2027-2030 |
| T2.1 | NYS Department of Environmental Conservation | 100% quarterly facility reporting by 2028; 65% diversion by 2035 | $0.02B | 0.01 | 736 | 2027-2030 |
| T2.2 | NYS Department of State / DEC (co-lead) | ≥ 12 categories certified by 2029 | $0.01B | 0.01 | 491 | 2027-2030 |
| T3.2 | Real estate owners / REBNY | 60% of top-50 landlords by 2028 | $0.42B | 0.24 | 3,358 | 2027-2030 |
| T3.4 | Trade unions (Building Trades, Carpenters, Laborers) | 5,000 new slots by 2030 | $0.32B | 0.19 | 3,010 | 2027-2030 |
| T3.1 | AEC firms (AIA NY, ACEC-NY, GCA-NY) | 75% by 2028 | $0.26B | 1.00 | 4,355 | 2027-2030 |
| T3.3 | NY Department of Financial Services + major carriers | ≥ 5 carriers underwriting reclaim by 2028 | $0.01B | 0.01 | 392 | 2027-2030 |
| T4.1 | Institutional investors (NYC pension funds, REITs) | $1.0B/yr by 2028 | $1.25B | 0.72 | 10,076 | 2027-2030 |
| T4.3 | Commercial banks (JPM, Citi, Signature, M&T) | $500M/yr of discounted origination by 2029 | $0.14B | 0.53 | 2,306 | 2027-2030 |
| T4.2 | Foundations (Rockefeller, Kresge, Surdna, Doris Duke) | $150M by 2030 across hubs + craft education | $0.01B | 0.01 | 392 | 2026 |
| Attributable totals | $9.11B | 9.13 | 81,429 | — | ||
Attributable totals reflect the portion of each strategy's opportunity that the named actors directly deliver. The full Chapter-5 opportunity of $36.8B per year includes market-driven capture that these recommendations enable but do not themselves execute.
The matrix reads three ways. Read vertically by tier, it is a distribution of administrative responsibility — who signs what order. Read horizontally by strategy reference, it is a distribution of the Chapter-5 opportunity — which dollars each policy unlocks. Read diagonally by horizon, it is an implementation schedule — the order in which instruments must fall into place so that each one arrives with the preconditions it needs. A reader using the CSV can sort on any of these three axes; the canonical presentation above is the tier-then-benefit sort because it is the presentation most legible to the Mayor's and Comptroller's offices during budget negotiation.
First 90 days
The Mayor's office can act on a subset of the matrix immediately, without state, federal, or legislative action. Four recommendations sit on the 2026 horizon and require only executive direction: DOB rule-making to require audit and floor-area publication on DM permits, DSNY commercial-tonnage reporting, LPC fast-track guidance for adaptive reuse, and a foundation program-related-investment (PRI) commitment from a named anchor institution, backstopping the first reuse-hub site acquisition. Together, these account for roughly $0.65B of annual benefit and 5,510 jobs — a first-quarter policy agenda that is fully within the executive's current authority.
Concretely, the ninety-day agenda divides into four administrative workstreams. The first is a DOB rule-making package (T1.1) drafted by the commissioner's office, requiring a pre-demolition material audit and a published floor-area figure on every DM filing. The draft rule can be issued through the agency's normal public-comment process under the City Administrative Procedure Act; the ninety-day target is for publication and opening of the comment window, not for final adoption. The second is a DSNY administrative order to BIC-licensed private carters (T1.4) requiring quarterly tonnage reporting by commercial waste category, executable under existing BIC rule-writing authority. The third is an LPC Commissioner's instruction to staff (T1.6) establishing the 30-day review latency target for Certificates of No Effect on qualifying adaptive-reuse filings. The fourth is a foundation program-related-investment (PRI) commitment (T4.2) from a named anchor institution, backstopping the first reuse-hub site acquisition and signaling capital readiness to downstream tiers.
None of these four actions requires Council approval; none requires state legislation; none requires federal coordination. All four can be substantially complete within the first ninety days of fiscal 2027. The combined institutional cost is an estimated 12–16 FTE across the four agencies, fundable within existing operating budgets and the Mayor's discretionary allocation. The combined first-year benefit — even before any downstream market response — is quantified above. The policy window is short: ninety days is the period in which the arithmetic of beginning is cheaper than the arithmetic of deferring.

If nothing changes
Every recommendation in this chapter is optional. The city can choose not to enact the DOB audit rule; the state can choose not to require carter parity; the federal government can defer WBLCA. The question is what the cumulative cost of those choices is, expressed as embodied carbon and as foregone economic activity. The counterfactual below answers it.

Between 2026 and 2030, status-quo inertia locks in approximately 20.8 MtCO₂e of new embodied carbon from NYC construction that would have been avoidable under the recommendations path. In economic terms, the foregone circular-economy value is approximately $173.1B over the same five-year window — the implied cost of deferring the actions in this chapter by a single compliance period. These are conservative figures: they do not include the operational emissions of the new stock, the avoided PACE origination, the foregone apprenticeship pipeline, or the avoided-penalty cash flow from LL97 non-compliance.
The counterfactual is the chapter's most useful reading frame. Every recommendation above is an attempt to bend one line on this chart toward the other. The Mayor's office need not believe every figure to make the comparison instructive; the two curves diverge even under adoption rates a quarter of those modeled here. The shape of the divergence is the policy argument. Its magnitude — roughly 21 MtCO₂e of avoidable embodied carbon and $173B of deferred value in a single five-year window — is what makes this chapter's twenty actions something other than a research wish list.
How to cite
Edwards, J. (2026). Building Prosperity in New York, Chapter 7: Recommendations. Aedifice Research, Report No. 01. Retrieved from https://aedifice-research.vercel.app/research/publications/building-prosperity/chapter-7-recommendations. Based on the six-strategy framework in Ellen MacArthur Foundation, Building Prosperity, July 2024, and on the empirical chapters of Report No. 01.
References
Primary sources, secondary benchmarks, frameworks
NYC primary sources (the city's open-data platform)
- NYC Department of City Planning. MapPLUTO. 818,108 tax-lot records; aggregated via the relevant fields to 1,076,507 buildings.
- NYC Department of Buildings. DOB Job Application Filings. Filtered to the relevant fields;NB, A1, A2, A3, DM}.
- NYC MOCEJ. LL84 Benchmarking.
- NYC DSNY. Monthly Tonnage. 1990–2026.
- NYC BIC. Trade-Waste Haulers. Deduplicated to 520 active carters.
- NYC BIC. C&D Registrants. Deduplicated to 1,967 registrants.
- NYC LPC. Designation Records — read via PLUTO
landmarkandhistdistcolumns. - U.S. Census Bureau. 2020 Decennial Census. Borough population totals.
- U.S. Bureau of Labor Statistics. OES Metro 35620 (May 2023). NY-NJ-PA occupational employment statistics.
Embodied-carbon & material frameworks
- Carbon Leadership Forum. Baseline Embodied-Carbon Studies (2023); Whole Building Life-Cycle Assessment (WBLCA) v2.
- Circular Ecology. Inventory of Carbon and Energy (ICE), v3.0.
- Royal Institution of Chartered Surveyors. Whole Life Carbon Assessment for the Built Environment, 2nd edition (2023).
- Ellen MacArthur Foundation. Circular Economy Principles (2015); Building Prosperity (July 2024); ReSOLVE framework (EMF / McKinsey, 2015). Six-strategy framework in Chapter 5 is a hybrid adapted from EMF with verbs drawn from Bocken et al. (2016) and ReSOLVE.
- Bocken, N., et al. (2016). “Product design and business model strategies for a circular economy.” Journal of Industrial and Production Engineering 33(5).
- European Union. Waste Framework Directive 2008/98/EC as amended by Directive (EU) 2018/851 — 65% municipal diversion by 2035.
- European Union. Directive (EU) 2024/1275 — EPBD recast. Material passports binding 2028.
Retrofit, energy & labor benchmarks
- Urban Green Council. Retrofit Market Analysis (June 2019); LL97 Compliance Path Analysis (2024).
- American Council for an Energy-Efficient Economy (ACEEE). Retrofit energy-savings benchmarks; jobs-per-$M multipliers (2022).
- Rocky Mountain Institute (RMI). Embodied-carbon sector guidance (2022, 2023).
- NYSERDA / NREL. Rooftop-solar technical potential studies (2018, 2022).
- Lawrence Berkeley National Laboratory. Retrofit-portfolio optimization research (2022–2024).
- NYU Furman Center. Gaining Ground: Options for Office-to-Residential Conversion in New York City (2023); LLC ownership-opacity analysis.
- Delta Institute. NYC Deconstruction Labor-Market Assessment (2022); C&D reuse-logistics studies.
Regulation, shadow values & peer-city benchmarks
- NYC Local Law 97 of 2019 — emissions from buildings over 25,000 sqft. NYC Admin. Code Title 28, Article 320.
- NYC Local Law 84 of 2009, Local Law 33 of 2018, Local Law 11 / FISP (Cycle 10, 2025–2030).
- NYC Department of Environmental Protection. Citywide Long-Term Control Plan. Central CSO avoided-cost value $1.68/gallon-year.
- U.S. Environmental Protection Agency. Social Cost of Carbon — 2023 update: $190/tCO₂e.
- NYC MOCEJ. 2023 Greenhouse Gas Inventory (~50 MtCO₂e citywide operational emissions).
- USDA / U.S. Forest Service. i-Tree Eco — urban ecosystem-services valuation framework.
- NYC Department of Sanitation. Commercial Waste Zone Implementation Plan (2019).
- Peer-city diversion: Eurostat (Amsterdam, Copenhagen); Ville de Paris Direction de la Propreté; London Waste & Recycling Board; Tokyo Clean Authority; SF Department of the Environment.
- Bygningsreglement BR18 §297. Danish Housing and Planning Authority, 2023 revision — 12 kgCO₂e/m²/yr embodied-carbon cap on new construction > 1,000 m².
- Build Reuse Directory (2024). Portland deconstruction-warehouse registry.
Dataset resource IDs, field-level transforms, chapter-by-chapter derivations, and pipeline code are published at /methodology. Every headline number in every chapter ties back to a named resource ID and a reproducible transform; where a source publishes a range rather than a point value, the range is preserved in the text.
How to cite
Edwards, J. (2026). Building Prosperity in New York: The Circular-Economy Case for the Built Environment. Aedifice Research, Report No. 01.