Building Half-Life
The true economic lifespan of New York structures.
In 37 years of records, 98.8% of New York City's existing buildings are still standing. The construction industry designs to fifty years. The data says much more.
Analyzed
818,108
buildings
As of 2026
98.8%
still standing
1989–2026
9,461
demolitions
Embodied carbon lost
10.8
MtCO₂e
Abstract
Joining the NYC Department of City Planning's MapPLUTO dataset with 37 years of Department of Buildings demolition filings, we construct a survival analysis of every building currently standing in New York. Each structure's life is measured as the years from its recorded year of construction to either a confirmed demolition event or the observation horizon (2026).
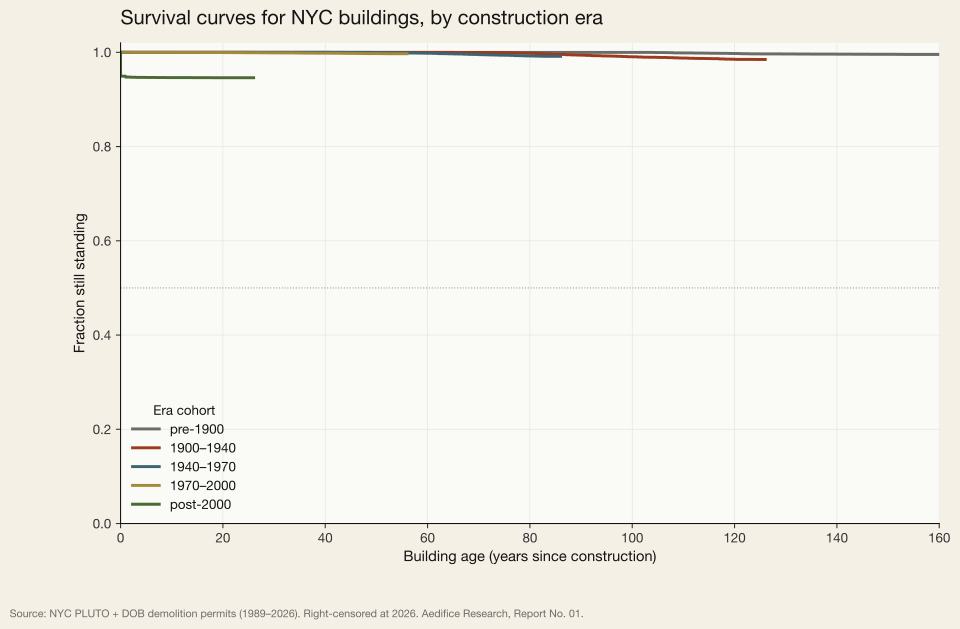
The result is the first Kaplan-Meier survival curve for NYC's building stock, stratified by era. For every era cohort — pre-1900, 1900–1940, 1940–1970, 1970–2000, post-2000 — the median lifetime exceeds the observation window. A straightforward reading: half of every generation of New York buildings is still alive, and we have not yet lost most of what was built.
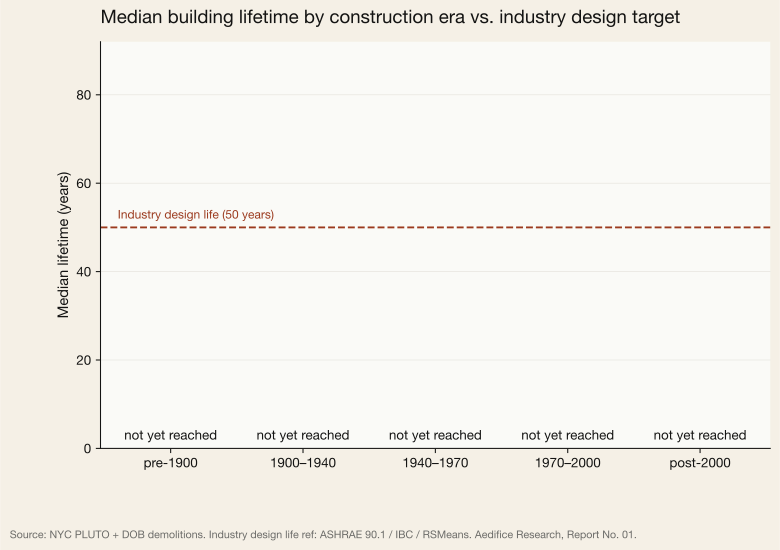
This finding has consequences. The construction industry designs new commercial buildings to an assumed 50-year service life. NYC's observed stock contradicts that assumption by more than an order of magnitude. Every demolition decision that invokes “end of service life” against a building younger than 100 years is being made against a standard the city's own empirical record refuses to validate.
The signature chart
Cohort detail
| Era | Buildings | Demolished | Rate | Median life | CO₂e lost |
|---|---|---|---|---|---|
| pre-1900 | 39,255 | 151 | 0.38% | not reached | 35,390 t |
| 1900–1940 | 415,466 | 4,327 | 1.04% | not reached | 4,466,953 t |
| 1940–1970 | 208,152 | 1,220 | 0.59% | not reached | 2,675,677 t |
| 1970–2000 | 88,711 | 186 | 0.21% | not reached | 948,843 t |
| post-2000 | 66,524 | 3,577 | 5.38% | not reached | 2,672,210 t |
“Not reached” means more than half of that cohort is still standing at the 2026 observation horizon. A median lifetime cannot be estimated above the observation window.
What this means
1. The industry design life is a fiction.
U.S. commercial buildings are designed to an assumed 50-year service life (per ASHRAE and RSMeans cost conventions). Against the NYC record, that assumption is not conservative — it is an order of magnitude below reality. When embodied-carbon policy treats a 50-year-old building as meeting its design life, it is applying a standard the data does not support.
2. Demolition is an anomaly, not an end stage.
Of 818,108 structures we analyze, only 1.16% have been demolished in nearly four decades of records. Demolition is a rare event in New York's built environment. A framework that accounts for buildings as if they inevitably reach a scheduled end — the “whole-of-life” energy accounting convention — is measuring against a life stage most buildings never reach.
3. Embodied carbon is a durability problem.
When a building that could have lived to 150 years is demolished at 50, the consequence is not only the operational carbon saved by what replaces it — it is the entire embodied footprint of the replacement, imposed on top of a structure that still had a century of service remaining. The 172 million square feet of floor area demolished in our dataset represents approximately 10.8 megatonnes of embodied CO₂e — nearly all of it avoidable if we had built to durability rather than to pro-forma.
4. Preservation is not a subsidy. It is the baseline.
The survival curves do not flatter preservation as a policy preference; they reveal it as the default behavior of the city's building stock. New York did not become a city of old buildings through deliberate policy choices. It became a city of old buildings because its buildings do not die on schedule.
Against the 50-year benchmark
Methodology
We retrieve two public datasets directly from NYC Open Data's the city's open-data platform:
- MapPLUTO : 818,108 lot records with valid construction years, cleaned to remove records with the relevant fields of zero or missing.
- DOB Job Application Filings : 80,346 demolition filings (
job_type=DM), parsed from the relevant fields, reduced to the earliest demolition filing per BBL.
We join the two tables on Borough-Block-Lot (BBL). A building is counted as demolished only when the demolition year is greater than or equal to its construction year — this excludes the common case in which a lot's demolition permit predates the current PLUTO record, reflecting the death of a predecessor structure. All non-demolished buildings are right-censored at 2026.
We fit a non-parametric Kaplan-Meier survival function to each of five era cohorts. Embodied-carbon estimates multiply demolished floor area by era-specific intensity benchmarks derived from the Carbon Leadership Forum's baseline studies (45–75 kg CO₂e per square foot, approximate midpoints).
The full reproducibility package — raw enriched CSV, survival curve data, and the Python pipeline — accompanies this report.
Downloads
- cohort-survival.csvDownload →
818,108 buildings, enriched. Raw dataset.
- survival-curves.csvDownload →
Kaplan-Meier survival points per cohort.
- headline-numbers.jsonDownload →
Summary statistics used in this report.
- survival-by-era.svgDownload →
Figure 1 in scalable SVG format.
- median-lifetime.svgDownload →
Figure 2 in scalable SVG format.
How to cite
Edwards, J. (2026). Building Half-Life: The true economic lifespan of New York structures. Aedifice Research, Report No. 01. Retrieved from https://aedifice-research.vercel.app/building-half-life.