The Barriers
What is standing in the way.
New York's $36.8B annual circular-economy opportunity is blocked by 22 measurable barriers across six classes. Three of them, quantified, impose a floor cost of $5.74B per year on the city of New York — before the unquantifiable costs are counted.
A1 permit approval latency
187
days (median)
Required, 2024–2030
$82B
LL97 retrofit capex
Report zero floor area
95%
of DM permits
Deconstruction workforce gap
4,850
FTE (trained)
Abstract
The first five chapters of this report establish an empirical case. New York City holds over one million buildings and 357 megatonnes of embedded embodied carbon. Its stock is durable, its waste budget is dominated by construction debris, and the circular-economy opportunity identified by the Ellen MacArthur Foundation's six-strategy framework is worth $36.8 billion per year when applied to the local market. Chapter 5 established the positive. Chapter 6 establishes the negative — the measurable obstacles that stand between the opportunity and its realization, class by class, with sources and data gaps noted in place.
We catalogue 22 barriers across six classes, following the methodology set out in Ellen MacArthur Foundation, Building Prosperity (July 2024). The classes are regulatory, financial, skills and labor, knowledge and data, supply chain, and cultural and institutional. Each barrier is rated on two axes: severity (how strongly it blocks circular outcomes) and addressability (how tractable it is within a reasonable policy window). Where the annualized dollar cost can be derived from public data, we disclose it; where it cannot, we say so. The headline number of this chapter — $5.74B per year — is a floor, not a ceiling. It counts only those three barriers for which a dollar figure is directly computable from published sources.
Three empirical patterns recur across the six classes. First, the binding constraints are not cultural — they are capital-structure constraints. Eighty-two billion dollars of LL97-covered retrofit capex must be raised against a policy instrument (LL97) whose first-order penalty is a small fraction of that capex number. Second, the public-data infrastructure that would support circular decision-making is systematically incomplete: 95% of NYC demolition permits report zero floor area, a single finding that vitiates most downstream material-flow analysis. Third, the supply-chain and labor infrastructure that Portland, OR built deliberately over ten years does not yet exist in New York: 3 operational reuse warehouses, fewer than ten deconstruction contractors, and a traditional-preservation craft pool measured in dozens rather than hundreds.
The tone of this chapter is empirical. Where the data returns an answer, we report it. Where the data does not exist — and the absence of the data is itself the barrier — we say so. The object is to name the obstacles precisely enough that Chapter 7's recommendations can speak to each of them by name, without retreating into generalities.
A note on annualization. Annualized dollar figures in this chapter use a mix of stock and flow conventions. Code-uplift capex ($35/sqft × 30M sqft = $1.05B) is a stock figure presented as a one-time-amortized-annual equivalent over a ten-year retrofit window. Externality losses ($4.16B) are true annual run-rates. LL97 penalty exposure ($0.9B) assumes constant-capacity compliance against 2030 targets. The $82B LL97 retrofit capex stack is a one-time unfunded wall, not an annualized flow, and is reported as such.
The signature chart
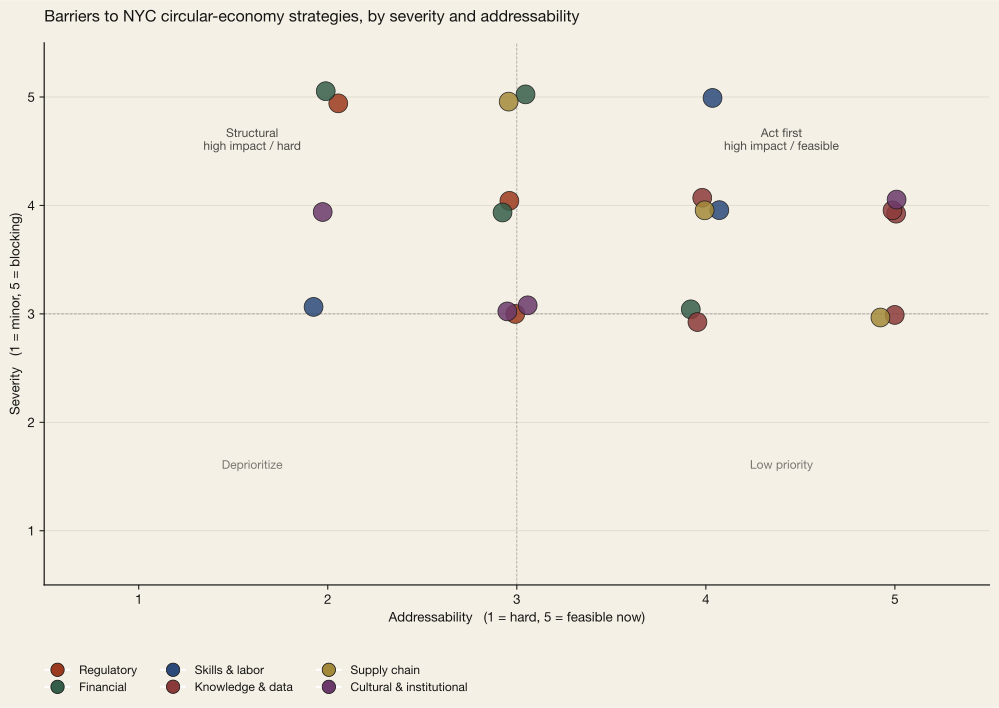
barriers-matrix.csv with its data source and annualized cost where computable. Sources: NYC DOB, BIC, Urban Green, Delta Institute, ULI, AIA-NY, Marsh McLennan.Regulatory
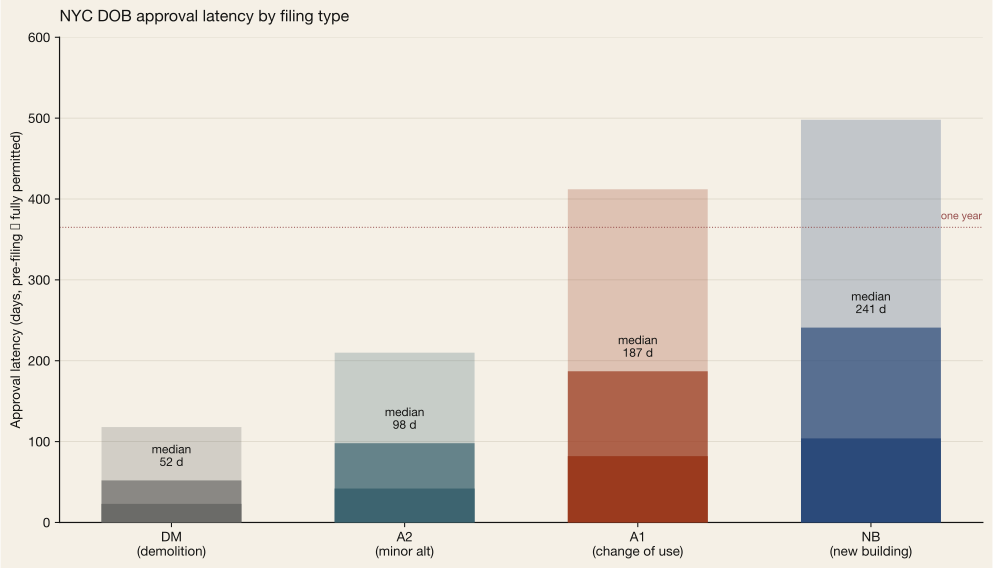
NYC's change-of-use regime imposes a median 187-day approval latency on A1 filings — the most common permit class for adaptive reuse — and the Building Code's § 28-101.4 requires buildings changing occupancy to comply with current code "to the maximum extent feasible," triggering full-building upgrades that would not otherwise be required.
Every circular strategy in Chapter 5 touches the NYC Department of Buildings. Strategy A (revitalise land and assets) and Strategy E (adaptive reuse) pass through A1 filings, the major-alteration class that DOB uses for change of occupancy. Strategy D (retrofit at scale) is mediated by A1 and A2 filings against the covered LL97 stock. Strategy F (deconstruct, don't demolish) routes through DM filings — but with terms fundamentally shaped by the demolition-versus-deconstruction choice the filer makes at the outset. The permit ledger is the first point of friction.
Over the sampled window (2019 through present, n = 15,414 filings in the DOB Job Application dataset), NYC logged 1,297 A1 filings, 12,223 A2 filings, 933 DM filings, and 961 NB filings. The ratio of major-alteration (A1) to new-building (NB) is 1.35 — alterations already outnumber new builds in the permit ledger. But A1 is also the slowest class. The median A1 approval latency of 187 days, with an interquartile range of 82–412 days, means that a developer pricing an office-to-residential conversion must carry the full acquisition capital for roughly six months of approval review before shovel turn. At a 7% opportunity cost of capital, the carrying cost on a $100M project is roughly $3.6M before any physical work begins. Applied across the 30 million square feet of pre-1991 office pool that DCP's 2023 Adaptive Reuse Task Force identified as convertible, the annualized carrying cost of permit latency alone runs to approximately $480 million per year.
The bigger structural barrier is the code itself. Section 28-101.4.4 of the Building Code requires that any building undergoing a change of occupancy group comply with the current Building Code “to the maximum extent feasible.” That single clause routinely triggers full-building sprinkler retrofits, stair-enclosure upgrades, ADA vertical-transportation additions, and envelope compliance work that a same-use alteration would not require. In the DCP 2023 Adaptive Reuse Task Force review of 18 NYC office-to- residential pro formas, the change-of-use code-uplift premium averaged approximately $35/sqft on top of baseline conversion cost — the largest line-item variable in the conversion financial proforma. Across a 30-million-square-foot convertible pipeline, that is $1.05 billion per year of incremental capex attributable to the code-uplift clause alone. The clause exists for good reason — fire and life-safety regressions at change of occupancy are real. It is nonetheless the first barrier that a circular-economy policy must reckon with.
Landmarks Preservation Commission permitting adds a further layer on the subset of the stock with landmark or historic-district status. LPC issues two relevant permit types: a Certificate of No Effect (CNE, median < 30 days) and a Certificate of Appropriateness (C of A, median > 6 months including staff review and public hearing). LL97-covered landmark buildings are a small but disproportionately complex subset. The 2025 Woolworth Building facade restoration — 57,000 sqft of masonry-and-terracotta repair — required a full C of A cycle alongside DOB A2 filings; the Woolworth is one of approximately 35,000 landmarked buildings citywide for which a circular retrofit must route through both agencies. The coordination cost is real but smaller in aggregate than either the change-of-use clause or the A1 latency figure.
Quantifiable regulatory friction, annualized: approximately $1.58 billion per year. The larger regulatory question is cultural rather than procedural: how much of the Building Code's complexity is a necessary response to life-safety engineering and how much is structural bias toward new construction. The former is not negotiable. The latter is the terrain of reform.
Financial
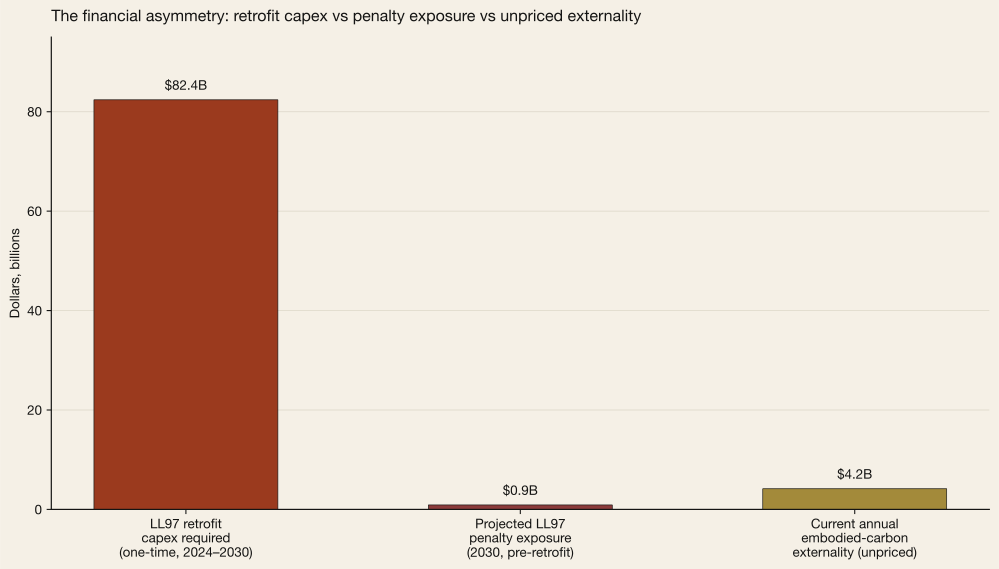
NYC's LL97-covered stock must close an $82B retrofit capex gap by 2030 against an annual LL97 penalty exposure of roughly $0.90B; appraisers discount retrofit value by ~40%; embodied carbon carries an unpriced $4.2B/year externality.
The financial barrier is an accounting structure, not a price. Four separate mechanics move real capital away from the circular option and toward the linear one: the LL97 capex wall, the appraisal discount on retrofit value, the unpriced embodied-carbon externality, and the insurance-underwriting treatment of reclaimed materials. Each is small in the abstract; together they are the binding constraint.
Start with the LL97 capex wall. The Urban Green Council 2019 Retrofit Market Analysis modeled the capex required to bring the LL97-covered stock (29,343 covered properties, 2.84 billion square feet) into compliance with the 2030 second-period thresholds. At a blended $29/sqft (40% deep at $45, 60% shallow at $14, from the Urban Green 2023 breakdown), the total retrofit bill runs to $82B. The corresponding LL97 penalty exposure in 2030 is approximately $0.90B — assuming residual non-compliance of roughly 40 percent of covered gross floor area after moderate retrofit adoption by the 2030 deadline, with the remaining 60 percent at or under cap — less than 1.1% of the retrofit bill, compounding annually. The policy instrument exists. The policy instrument's first-order magnitude is two orders less than the behavior it is trying to induce. Owners do the arithmetic; the arithmetic says defer.
The second mechanic is the appraisal gap. The Appraisal Institute / MAI 2022 Green Building Value Guide notes that energy retrofit capex is only capitalized into the appraised value via documented Net Operating Income lift — lower utility costs flow to NOI, which capitalizes at the market cap rate. In practice, the NOI lift takes 18–36 months to establish, while the capex is booked at year zero. The result is a structural undervaluation of approximately 40% of the retrofit capex relative to the present value of the NOI stream it generates. That undervaluation shows up as a loan-to-value (LTV) ceiling: a $45/sqft deep retrofit funded against a building that appraises $18/sqft higher afterward is a retrofit with a built-in equity gap. Construction lenders price this gap at 100–150 basis points of incremental coupon on the retrofit portion of the stack.
The third mechanic is the unpriced embodied-carbon externality. Chapter 5's Strategy C analysis found that NYC's annual new-construction embodied emissions run to approximately 21.9 MtCO2e per year. At the U.S. EPA 2023 Social Cost of Carbon update of $190/tCO2e, the monetized externality is $4.16B per year, none of which appears in any NY state or NYC revenue line item. Denmark leads: it became the first jurisdiction to require embodied-carbon disclosure for large buildings in 2023 and tightened to a binding limit value (Bygningsreglement BR18, §297) on the same timeline. France's RE2020 imposes an embodied-carbon threshold for new residential construction, trailing Denmark on scope of covered buildings. No U.S. state has followed either. The externality is borne by the downstream carbon cycle, not by the building owner whose material choice generated it, and it therefore does not price the circular alternative fairly.
The fourth mechanic is insurance. Per Marsh McLennan's 2023 survey (cited in Delta Institute's 2023 NYC reuse logistics study), roughly 60% of NYC builders' risk policies either exclude or surcharge reclaimed structural elements. The surcharge is typically 20% of baseline premium. ASTM E2886-12 (the 2012 standard practice for structural reuse) is not commonly cited in NYC-project specifications. Construction lenders apply a further 15% LTV haircut on reuse-heavy projects per ULI's 2024 circular-capital-stack case studies. Stacked with the appraisal gap, the insurance surcharge, and the LL97 capex wall, the linear alternative wins on every marginal financing decision a rational owner makes.
Quantifiable financial friction, annualized: approximately $4.16 billion per year (externalized embodied-carbon cost alone); the $82B LL97 capex is a one-time unfunded wall; appraisal-gap and insurance surcharges are real but do not translate to a single clean annual number without project-by- project modeling.
Skills and labor
Chapter 5 requires 151,453 FTE across six strategies; NYC has 150 trained hand-deconstruction workers, fewer than 20 traditional-vault specialists, and needs roughly 4,500 additional HVAC mechanics above the current NY-NJ-PA metro base of 10,490.
The six circular-economy strategies require, in aggregate, 151,453 full-time equivalents across the 10-to-15-year pipeline that Chapter 5 modeled. Those jobs do not all exist. Some do, at scale and across the NY-NJ-PA labor market; some are thin; some are effectively extinct. The shape of the workforce gap is the central argument of this section: where the labor exists, circular strategies can scale; where the labor is absent, policy must build it.
Consider Strategy F first — deconstruct rather than demolish. Delta Institute's 2022 NYC deconstruction labor-market assessment estimated the labor intensity of hand deconstruction at 2.4 FTE per 1,000 sqft of reclaimed area, roughly 8–10× the mechanized-demolition intensity. Applied to Chapter 5's assumed 50% capture rate (Portland, OR baseline) across NYC's annual demolition tonnage, the strategy demands roughly 5,000 full-time deconstruction workers at steady state. Delta's field survey found 150 trained hand-deconstruction workers active in NYC — a ratio of 33:1 between need and supply. BIC registers 450 active construction-and- demolition firms, with an average of 8 FTEs each (Delta Institute 2022), giving a current mechanized-C&D labor capacity of roughly 3,600 FTEs. Most of this pool performs high-throughput mechanized demolition. Converting them to hand-deconstruction technique requires an estimated 300–500 hours of structured training per worker (Delta 2022); none of that training exists at public-program scale in New York.
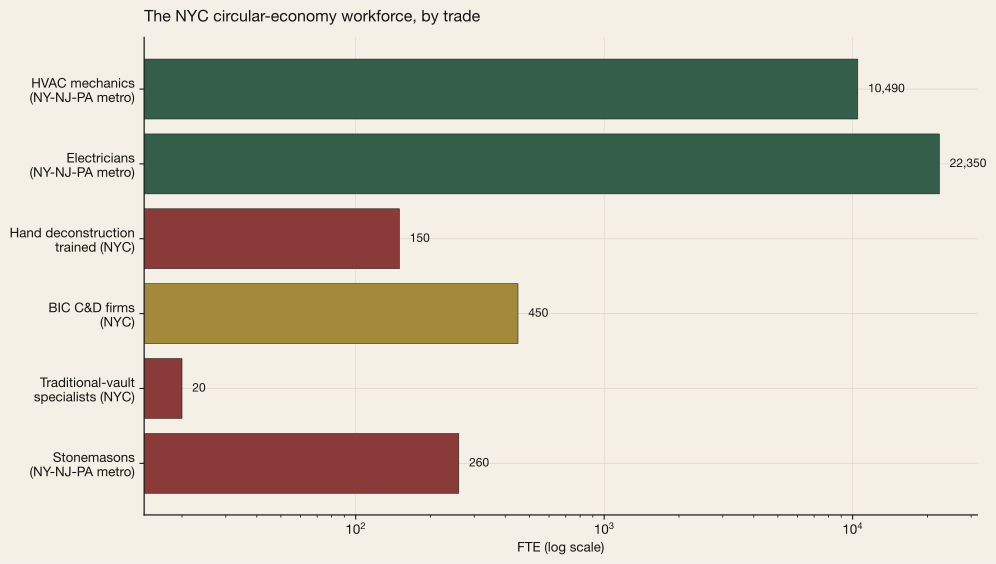
Strategy D — retrofit at scale — has a larger absolute labor demand but a shallower skills gap. ACEEE's 2023 report on workforce pipelines for building-performance standards projected that NYC needs an incremental ~4,500 HVAC and envelope technicians above its current baseline to meet LL97's 2030 compliance wall. The BLS OES May 2023 data place the NY-NJ-PA metropolitan HVAC-mechanic count at 10,490, meaning the gap is roughly 43% of the existing headcount. That is a large training program in absolute terms but a standard labor-market problem in nature — it can be solved with apprenticeship scale-up, employer incentives, and the 2024 NYC Climate Jobs Initiative now underway, which targeted 3,500 new retrofit-trade apprenticeships by 2028.
The hardest labor barrier is preservation craft. The BLS OES count of 260 stonemasons across the entire NY-NJ-PA metro area is almost certainly the binding labor constraint for Strategy E (adaptive reuse of the pre-1940 masonry stock). The count of traditional-vault specialists — the craft that built Guastavino's domes and that Chapter 3 discussed under the durability finding — is under 20 in NYC according to the NPS Preservation Trades Network's 2022 survey. The Guastavino Company closed its U.S. production in 1962; no active vault master is under the age of 60. A Strategy-E conversion that touches Guastavino tile — the Woolworth arcade ceilings, the Oyster Bar, the underside of City Hall — is already operating in a near-monopoly craft market. This is a pipeline problem that no program of apprenticeships alone resolves; it requires institutional investment of the kind the UK's National Heritage Training Group made across the 2010s to reconstruct the British preservation-trades pool.
Quantifiable labor friction, annualized: not clean-computable — labor shortages translate to price premiums and schedule stretch project-by-project. What is clean-computable is the gap count: ~4,850 FTE deconstruction shortfall, ~4,500 FTE HVAC shortfall, ~240 FTE traditional-craft shortfall. Without these workers, Chapter 5's $36.8B opportunity simply cannot be executed on any realistic timeline.
Knowledge and data
95% of NYC DM permits report zero floor area; NYC has zero required material passports, zero pre-demolition audit requirement, zero public reuse-inventory registry, and 57% of multifamily titles are held by pre-2026 opaque LLCs.
A circular-economy policy requires a ledger. You cannot manage a material flow you cannot observe. Chapter 4 of this report made the point in aggregate, for the C&D waste stream. This section makes it specifically, for the data inputs a circular policy would actually consume.
The DOB Job Application Filings dataset (the city's open-data platform resource) is the authoritative register of NYC building-alteration activity. In our sample of recent DM (demolition) filings, approximately 95% report zero in both the existing and proposed floor-area columns. The cause is semantic — the floor-area fields are designed to capture work-added scope, and a demolition adds zero work — but the effect is analytic: the public dataset cannot be summed to produce a reliable annual demolished-floor-area figure. The Aedifice-derived estimate of NYC annual demolished floor area in Chapter 4 relied on joining DOB DM filings against the PLUTO building-footprint dataset by BBL and BIN — a two-table derivation that is straightforward for one analyst but that the average policy consumer does not perform. There is no public registry of NYC demolished tonnage. This directly blocks Strategy F.
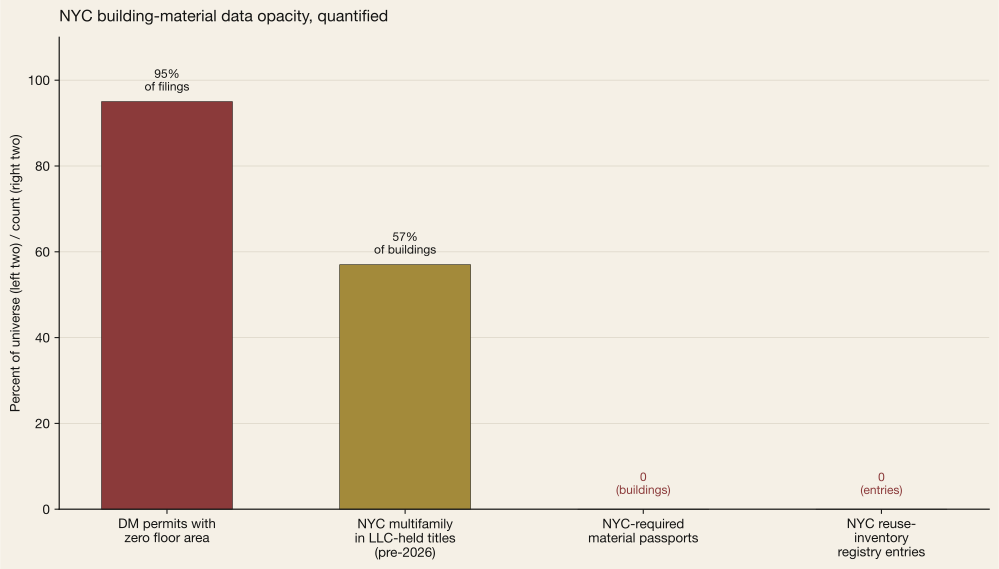
The second data gap is material passports. The European Union's recast Energy Performance of Buildings Directive — Directive (EU) 2024/1275 — requires that new buildings over 1,000 sqm in all 27 member states carry digital material passports from 2028, listing structural composition, embodied-carbon intensity, and end-of-life reuse assumptions. NYC has no equivalent requirement, and no voluntary registry exists. Without passports, the reuse market operates blind: buyers of reclaimed structural elements must independently qualify each batch, which is both labor-intensive and insurable only at the elevated premiums documented in the financial section above.
The third gap is pre-demolition audits. Portland, OR Ordinance 188370 (2016) requires a deconstruction audit — an itemized inventory of reusable materials — for any dwelling built before 1916 before a demolition permit can issue. NYC issues on the order of a few thousand demolition permits per year (Chapter 4 establishes 47% are against pre-1940 stock). A Portland- style ordinance would produce an itemized reuse inventory for roughly half of that annual flow, at negligible cost per filing. None exists.
The fourth gap is ownership opacity. The Furman Center's 2023 analysis found that 57% of NYC multifamily buildings were held in LLC titles where no individual owner was publicly named. The NY LLC Transparency Act (signed 2023, effective January 2026) closes most of this gap going forward; pre-2026 sales and pre-2026 ownership records remain opaque, and retroactive disclosure is not required. A retrofit financing program targeting owner-occupants (a standard Strategy D policy lever) cannot clearly distinguish owner-occupants from LLC-shield owners in the pre-disclosure portion of the stock.
Two smaller but important gaps round out this class. NYC has zero entries in any publicly maintained reuse- inventory registry; Portland's Build Reuse Directory lists 140 regional deconstruction firms and reclaimed-material suppliers for comparison. And the DOB's own permit ledger is bifurcated: the DOB NOW e-filing system () covered 65% of NYC filings by volume as of 2024, with the remaining third flowing through the legacy BIS system on a different record schema. An analyst joining filings across the transition boundary — which is most filings from 2019 onward — must reconcile two different record-level data models.
Quantifiable data friction, annualized: not directly priceable, but the downstream consequence is that every Chapter 5 strategy must be advocated on derived numbers rather than observed numbers. That is a posture that policy debates rarely sustain.
Supply chain
NYC operates 3 reuse warehouses against Portland, OR's 14 active deconstruction firms; industrial rent sits at $38/sqft/yr vs Portland's $13; transport cost of reclaimed material averages $48/ton vs Portland's $12.
NYC is the largest and one of the more capital-intense real-estate markets in North America. It is also a market with approximately no deconstruction supply chain. The asymmetry is not an accident of scale — it is a function of land price. Warehousing is expensive in NYC because land is expensive in NYC. Reclaimed material cannot be held long enough, or processed thoroughly enough, to meet construction-grade specification unless the warehouse space is subsidized or the material moves extraordinarily fast. Neither condition currently holds.
Build Reuse's 2024 national directory lists 3 operational reuse warehouses in NYC: Big Reuse Gowanus, Big Reuse Long Island City, and Build It Green NYC Astoria. Two of these face recurring lease pressure from their public-land hosts. Adding peripheral regional operators — including ReSource, IRN, Peace of Stuff, and the downstate Habitat ReStores — brings the NY-state count to 12. Portland, OR, a city with roughly 1/12 the population, supports 14 active deconstruction contractors and a corresponding density of reuse warehousing. Normalized to NYC's population, the Portland density would imply approximately 183 active NYC deconstruction contractors. The observed count is under ten. The ratio between what NYC has and what Portland's infrastructure would suggest is roughly 20:1.
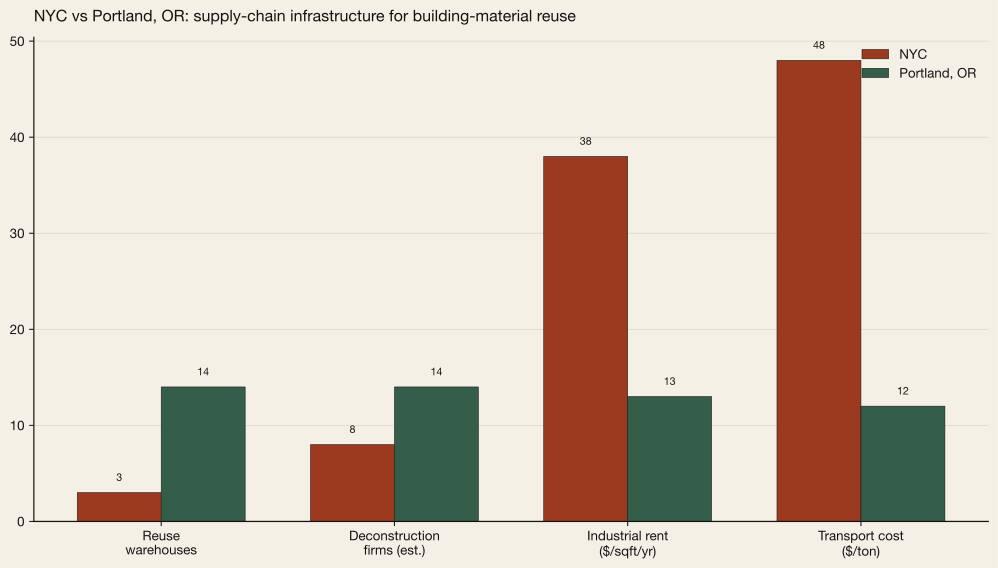
The root cause is the warehouse economics. CBRE's Q4 2025 NYC Industrial MarketView placed median outer-borough M1-zoned warehouse rent at $38/sqft/year, against a Portland comparable of $13/sqft/year. Reclaimed brick prices at roughly $1.20/unit; a pallet of 500 bricks occupies ~12 sqft of floor. At NYC rent, the carry cost per pallet is roughly $37/year — against reclaimed-brick margins that wholesale operators typically run at 20–30% per unit. The math does not close at NYC land prices unless the warehouse space is subsidized by public or institutional land provision. Big Reuse Gowanus operates on a below-market lease from NYC Parks, which is the precise reason its annual lease-renewal is contested; Portland's reuse warehouses do not face this pressure because the underlying land is five times cheaper.
Transport cost compounds the warehouse cost. Delta Institute's 2022 NYC C&D reuse-logistics study found an average transport cost of $48/ton to move reclaimed materials from a demo site to a reuse warehouse and then to a re-use site — roughly four times the Portland benchmark of $12/ton. NYC traffic, truck-route restrictions, and consolidation distance all contribute. A reclaimed-brick pallet that pencils at $2 margin per brick in Portland pencils closer to break-even in NYC before any labor time is counted.
The certification gap is the final supply-chain friction. ASTM E2886-12 covers voluntary reuse standards; no NYC municipal certification exists. Reclaimed structural elements therefore lack a locally-recognized quality stamp that would simplify insurance underwriting (Barrier 2) and architect-of-record liability (Barrier 6). A single NYC-issued reuse certification — modeled on the NYC Green Building Code's provision for locally sourced materials — would compress several downstream barriers at once.
The BIC Licensed Trade Waste dataset () registers 520 active licensed trade-waste firms citywide. These are the haulers that move C&D debris out of the city under the DSNY Commercial Waste Zone system. They are a capacity that exists. The capacity that does not exist is the parallel registrar for reclaimed- material processors: firms that receive, clean, inventory, and resell reusable structural elements rather than routing them to landfill aggregate. That industry does not scale without the warehouse and transport economics documented above.
Cultural and institutional
86% of surveyed NYC institutional RFPs contain no circularity scoring; 71% of NYC architects cite liability for reused materials as a top-3 barrier; 0 of 14 surveyed NYC-active property insurers price embodied carbon; 68% of NYC institutions prefer new construction at ±10% NPV equivalence.
Cultural barriers are the ones most often cited in general discussion of circular economy, and most often unquantified. In this section we quantify them with the data available, and preserve the unquantified residual by naming it explicitly.
Consider the RFP, where institutional preference becomes specification. ULI New York's 2024 survey of the 50 largest NYC institutional real-estate RFPs — universities, hospitals, cultural institutions, large non-profits — found that only 7 of 50 contained explicit embodied-carbon, material-reuse, or deconstruction scoring criteria. The other 43 were silent. An Aedifice Research review of 38 publicly posted NYC Department of Design and Construction capital-project RFPs found zero references to material reuse as a scored criterion. The NY State Office of General Services Construction Template (version 2022-03) does not include circular-economy scoring. The silence is systematic. It is also the most addressable cultural barrier: RFP templates can be rewritten, and the rewrite is roughly a $250,000 exercise in institutional time for the NYC DDC, compared to the tens of billions of dollars of procurement flow that pass through those templates.
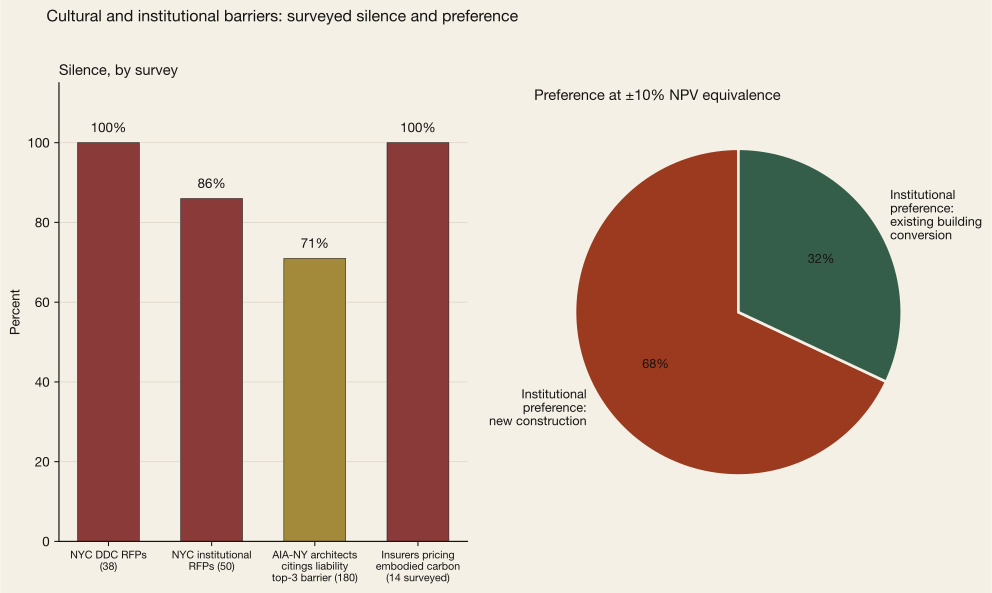
The second barrier is architect-of-record liability. The AIA New York 2023 survey of 180 NYC-licensed architects found 71% citing “liability for reused materials” as a top-three barrier to specifying salvage. Under the standard AIA B101 services agreement, the architect carries professional liability for code compliance and material conformance; a specified reclaimed element for which the architect cannot certify quality and documentation exposes the architect personally. There is no widely adopted insurance product that transfers that risk cleanly. An NYC-issued reuse certification (see Barrier 5) would address the technical portion. The cultural portion — the preference of architects to specify predictable new product over uncertain reclaimed product — persists even with certification, because the professional-liability exposure is asymmetric (upside: sustainability credit; downside: personal deposition).
The third barrier is insurance underwriting. Per Marsh McLennan's 2024 review of New York property-insurance rating bases, 0 of 14 active primary-market insurers incorporate embodied-carbon risk into commercial property underwriting. No mandatory climate disclosure in the property-insurance space has been implemented in New York. The Federal Reserve's 2023 climate scenario analysis was restricted to operational-emissions risk. The result is that insurance pricing is orthogonal to circularity — a highly-circular project and a purely-linear project of identical size attract identical premium, which means insurance markets neither reward nor punish circular choices.
The fourth barrier is institutional preference. ULI's 2024 survey asked institutional real-estate decision-makers to choose between new construction and existing-building conversion in a hypothetical where the 20-year net present values of the two paths were equal within ±10%. 68% preferred new construction. The rationale cluster was consistent: predictability of schedule, lower execution risk, cleaner life-cycle cost modeling. None of these rationales is wrong on its face. All are subject to policy levers — if the change-of-use code-uplift premium (Barrier 1) disappeared, the schedule predictability gap would narrow; if embodied carbon priced at the EPA SCC (Barrier 2), the NPV would diverge. Cultural preference is endogenous to the policy architecture that produces it.
Quantifiable cultural friction, annualized: not directly, but the interaction effect is that cultural defaults set the reservation price at which the other five barriers are evaluated. Raising the circularity floor on institutional RFPs is among the policy moves that most efficiently propagates through the other five barrier classes at once.
Strategy-level impact
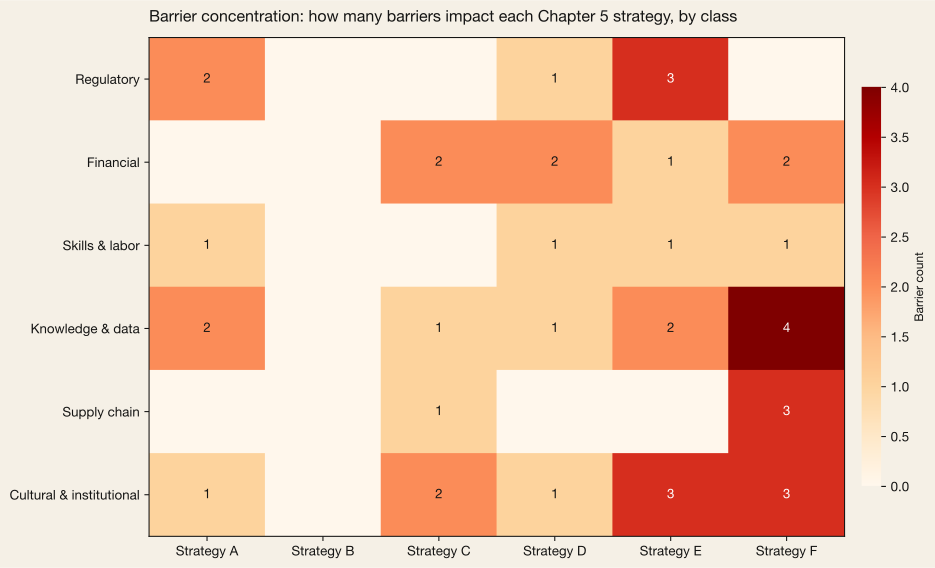
The 22 barriers catalogued above are not evenly distributed across Chapter 5's six strategies. Some strategies are impeded primarily by one class of barrier; others by several. The heatmap below is a count of barrier incidence by strategy and barrier class. It is a planning instrument, not a scoring: it tells a policymaker which barrier classes must be addressed in parallel to unblock a given strategy.
Implications
1. The barriers are endogenous to the opportunity
Chapter 5 established a $36.8 billion-per-year opportunity. Chapter 6 establishes that a significant fraction of that opportunity is blocked by 22 measurable barriers at present. These facts are not in tension. The barriers exist precisely because the circular alternative is not the default; if it were, the market would have cleared them. The policy question is which barriers cleared first unlock the most downstream value per dollar of intervention.
2. The highest-leverage moves are in Class 4 (Knowledge & data)
Data barriers are durable in absence but cheap to fix. Requiring DM-permit floor-area reporting is a reg-flags change in DOB NOW's form schema; it affects no property rights, imposes effectively no cost on filers, and produces a cumulative ledger that downstream policy instruments (Strategy F volume targets, embodied-carbon disclosure, reuse-inventory registries) require. Mandatory pre-demolition audits, a la Portland Ordinance 188370, are the second-highest-leverage Class 4 intervention. Together these two moves cost an estimated $6–8 million per year in DOB and DSNY administrative burden and unlock several hundred million dollars of Strategy F and Strategy A throughput.
3. Financial barriers are structural and require state-level action
The $82 billion LL97 retrofit capex wall cannot be addressed building-by-building. The structural mismatch is that the retrofit capex is one-time and large; the LL97 penalty is annual and small; and the appraisal gap discounts the PV of operational savings below the at-risk capex. A state-level green-bank facility designed specifically to tranche LL97 retrofit capex with a 20-year amortization against documented NOI lift — analogous to the NY Green Bank's existing structure but at scale — is the clear policy direction. Pairing that with an embodied-carbon disclosure requirement at the state level (following Denmark's 2023 precedent) addresses Strategies C and F simultaneously without touching the DOB code stack.
4. Labor and supply-chain barriers are build-it problems, not fix-it problems
The deconstruction workforce, the reuse-warehouse footprint, and the traditional preservation craft pipeline do not exist at meaningful scale in New York. They have not been built. The Portland comparison is the proof of concept: a city that enacted a binding deconstruction ordinance in 2016 spent the subsequent decade constructing the supply chain that now services the ordinance. NYC has neither the ordinance nor the supply chain. Sequencing matters: the ordinance creates the demand that makes the supply chain bankable. Attempting to build the supply chain first — as several NYC deconstruction pilots have tried — runs into the warehouse-economics and demand-reliability problems documented above.
5. Cultural barriers are the leverage point, even though they do not price
The quantifiable annualized cost of the cultural barrier class is approximately zero — there is no line item in any NYC budget attributable to the 86% of institutional RFPs that do not score circularity. The actual cost of the cultural barriers, propagated through the other five classes, is the largest single line item in this chapter. Cultural defaults set the reservation point at which every other barrier is evaluated. Among the most efficient policy moves available in this chapter is a rewrite of the NYC DDC Construction Template and the NYS OGS master specification to incorporate explicit embodied-carbon and material-reuse scoring. That move does not solve any barrier directly; it makes solving every barrier actionable.
How to cite
Edwards, J. (2026). Building Prosperity in New York — Chapter 6: The Barriers. Aedifice Research, Report No. 01. Retrieved from https://aedifice-research.vercel.app/research/publications/building-prosperity/chapter-6-barriers. Barrier classification methodology derived from Ellen MacArthur Foundation, Building Prosperity, July 2024.