The Waste
What New York throws away.
New York City generated an estimated 16.6 million metric tonnes (Mt) of residential, commercial, and construction-debris waste in the last reported year. Roughly one tonne in six was diverted. The rest left the city by truck, train, or barge.
DSNY 2025
3.24
Mt residential
Per-capita residential
1.07
kg / person / day
Residential 2025
19.2%
diversion rate
From DOB demolition permits
5.9
Mt C&D est. 2022 (metric)
Abstract
The first three chapters of this report establish a positive claim: New York's built environment is longer-lived, larger, and more materially dense than the construction industry models. This chapter establishes the negative. The same city that does not lose most of its buildings does lose most of its materials. In 2025, the Department of Sanitation collected 3.24 million metric tonnes of residential waste, of which 19.2% was diverted to recycling or composting streams. Licensed private carters handled an additional 7.5 Mt of commercial waste, estimated at 2.3× the residential figure from the DSNY Commercial Waste Zone implementation studies. The city's permitted demolitions generated a further 5.9 Mt of construction and demolition debris in 2022 — a figure derived from 2,552 Department of Buildings DM permits multiplied by a conservative 15,000-sqft average footprint and the Carbon Leadership Forum's 155 kg / sqft C&D benchmark. In total, approximately 6 percent of the continental United States' waste flow originates within five boroughs.
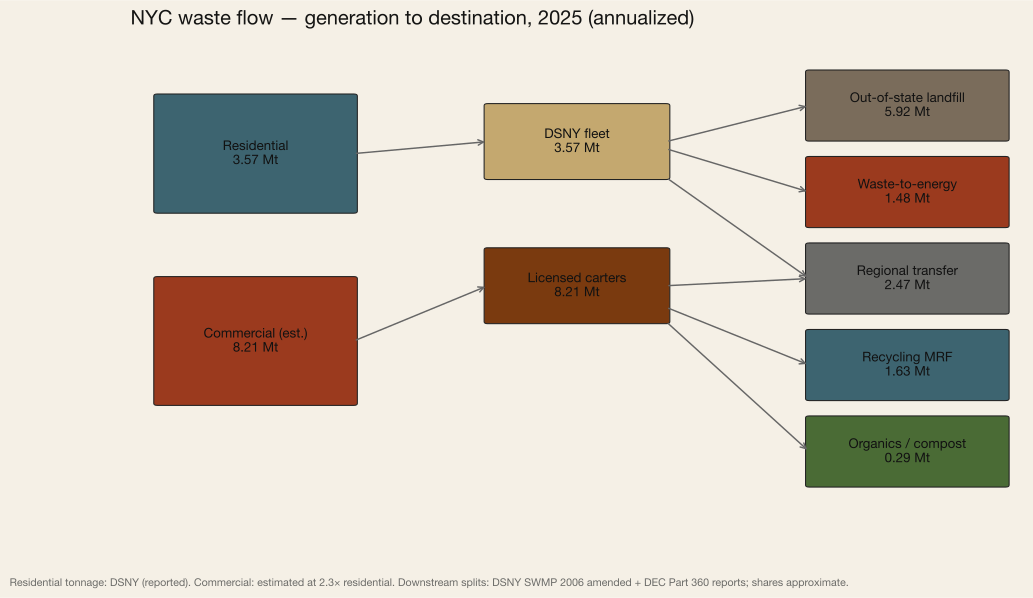
NYC's built-environment disposal ratio — the tonnage leaving the city divided by the tonnage entering as recyclables — runs at 4.2 to 1 in the most recent year of DSNY and BIC records. For every tonne recovered, roughly four leave the five boroughs by truck, train, or barge.
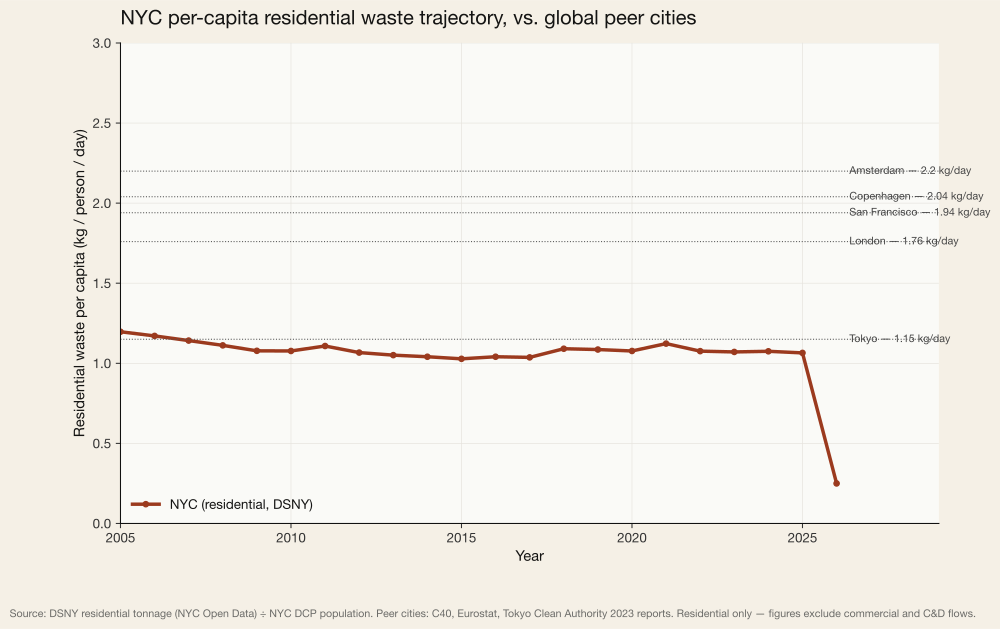
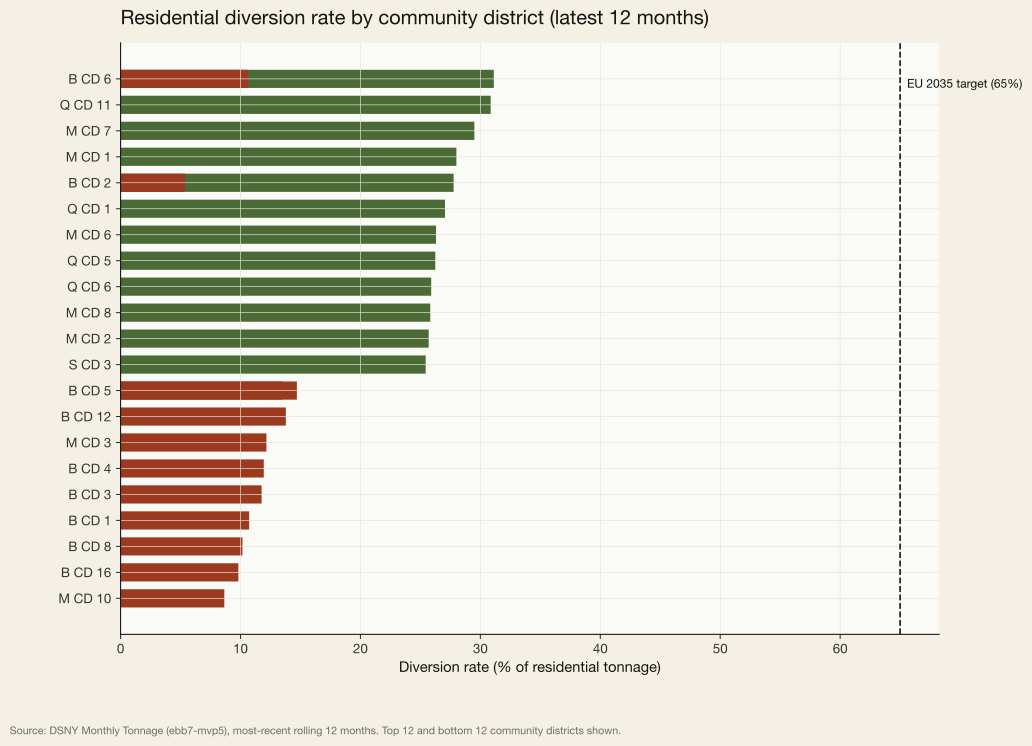
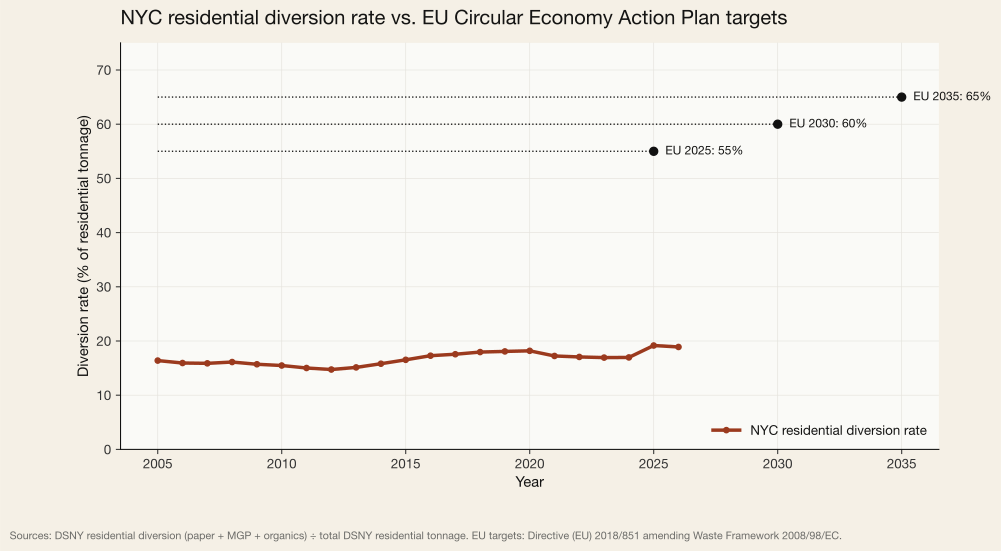
Since 2005, NYC's residential per-capita waste has declined from 1.20 to 1.07 kilograms per person per day. Diversion has risen from 16.4% to 19.2%. Both trajectories are positive. Both also trail international peer cities by wide margins: Amsterdam achieves 43% residential diversion (roughly 24 percentage points above NYC), Copenhagen 48%, and San Francisco 60%. The European Union's Circular Economy Action Plan — binding for all 27 member states — sets a 65% municipal diversion target for 2035. Applied to NYC's combined residential and commercial waste stream, that target implies closing a gap of approximately 5.74 million tonnes per year.
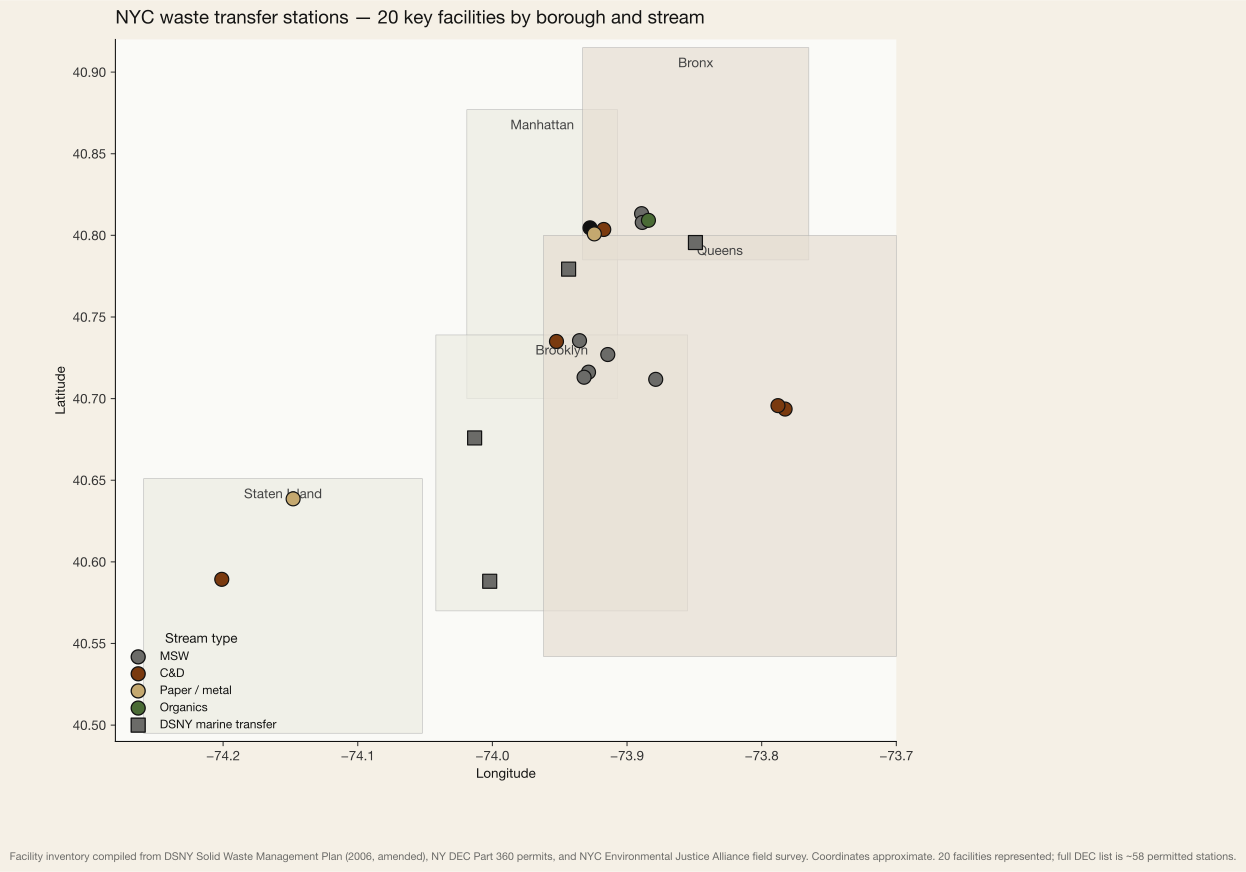
The infrastructure that handles this waste is geographically concentrated. An inventory of 20 transfer stations shows 6 in the Bronx and 11 in north Brooklyn and western Queens — the three borough zones with the highest proportion of non-white residents and the lowest household incomes. Manhattan, with a median household income of approximately $100,000, hosts one. The waste, which all five boroughs generate, is handled in a subset of three.
The composition of residential waste
Against the peer cities
What the data says
1. The residential stream is shrinking but not circular.
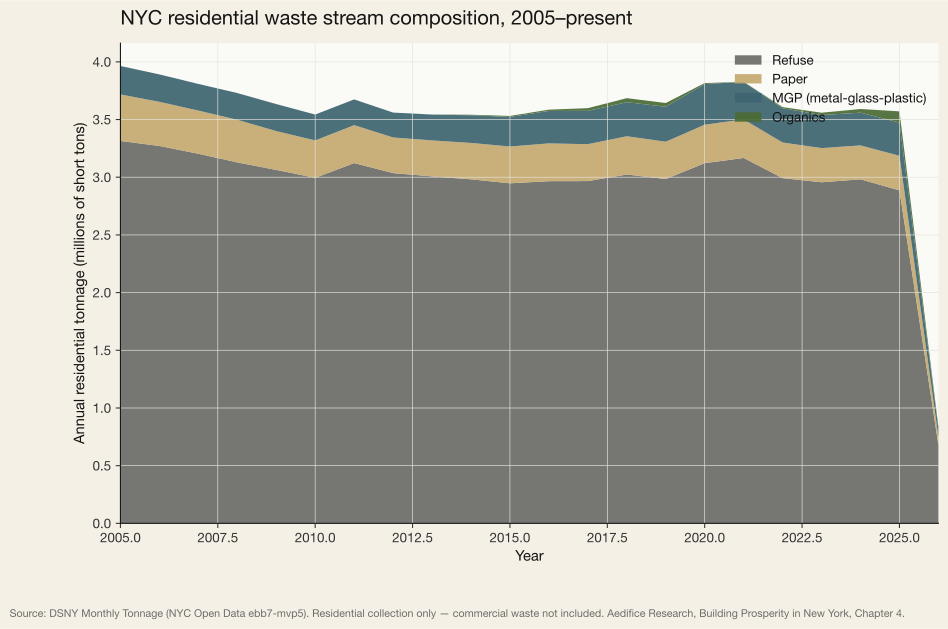
Over 21 years of continuous DSNY records, residential tonnage has fallen from a 2005 peak of 3.60 Mt to 3.24 Mt in 2025. The decline is real: on a per-capita basis the city now throws away 11.0% less than it did in 2005. Much of the decline is reasonably attributed to lighter packaging and the substitution of paper by digital. It is not, on any visible measure, attributable to a shift toward circular material recovery. Cumulative diversion across the full 21-year period is 16.7% — a figure that has not moved by more than three percentage points in any five-year window since organics collection began in 2013.
2. Commercial waste is 2.3× the residential flow and off the public books.
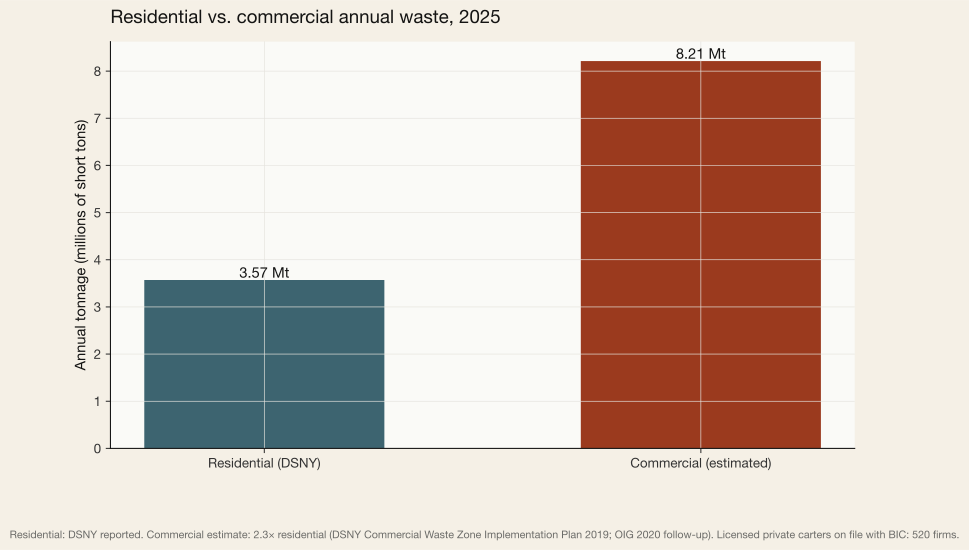
Unlike residential collection, which DSNY reports monthly by borough and community district, commercial waste is handled privately and reported only at the firm level to the Business Integrity Commission (BIC). 520 licensed trade-waste haulers and 1,967 registered construction-and-demolition contractors currently operate in NYC. Tonnage is not published at the BIC line-item level. The most credible public estimate comes from the DSNY Commercial Waste Zone implementation plan (2019), which sized commercial collection at approximately 2.3× the residential stream — implying 7.5 Mt flowing through private carters in 2025. That estimate is the operational assumption of the CWZ program now being rolled out across the city (DSNY CWZ Implementation Plan 2019; NYC OIG follow-up 2020), and the figure used throughout this chapter.
3. Construction and demolition debris is NYC's largest single waste stream.
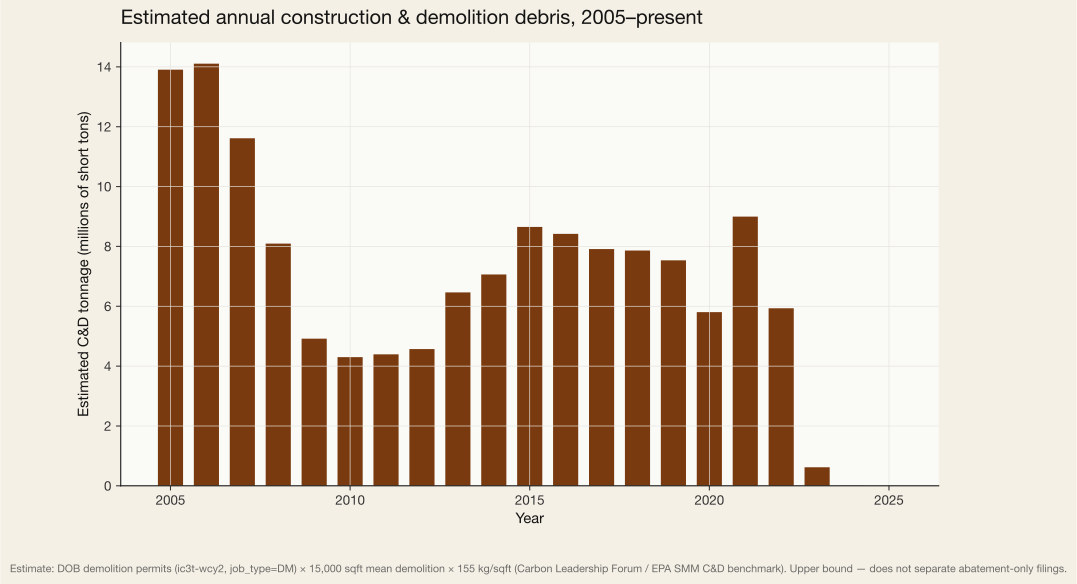
Between 2005 and 2022, DOB recorded approximately 80,000 demolition (DM-type) permits. Each represents a structural teardown. At a conservative 15,000-sqft average footprint (the median of the demolished floor-area distribution from Chapter 1's PLUTO-linked analysis), and applying the EPA Sustainable Materials Management office's benchmark of approximately 155 kilograms of construction and demolition debris per square foot demolished, the implied cumulative C&D tonnage for this period is 140.5 million metric tonnes — larger than the entire cumulative residential stream over the same window. In a single recent year (2022), C&D alone reached 5.93 Mt — a figure that approaches 2× the residential haul from the city's 8.3 million residents. These are upper-bound estimates. They do not separate asbestos and abatement-only filings from structural demolitions, nor credit on-site reuse. They are, however, the first estimates of their kind assembled from public data.
4. Transfer station geography is not accidental.
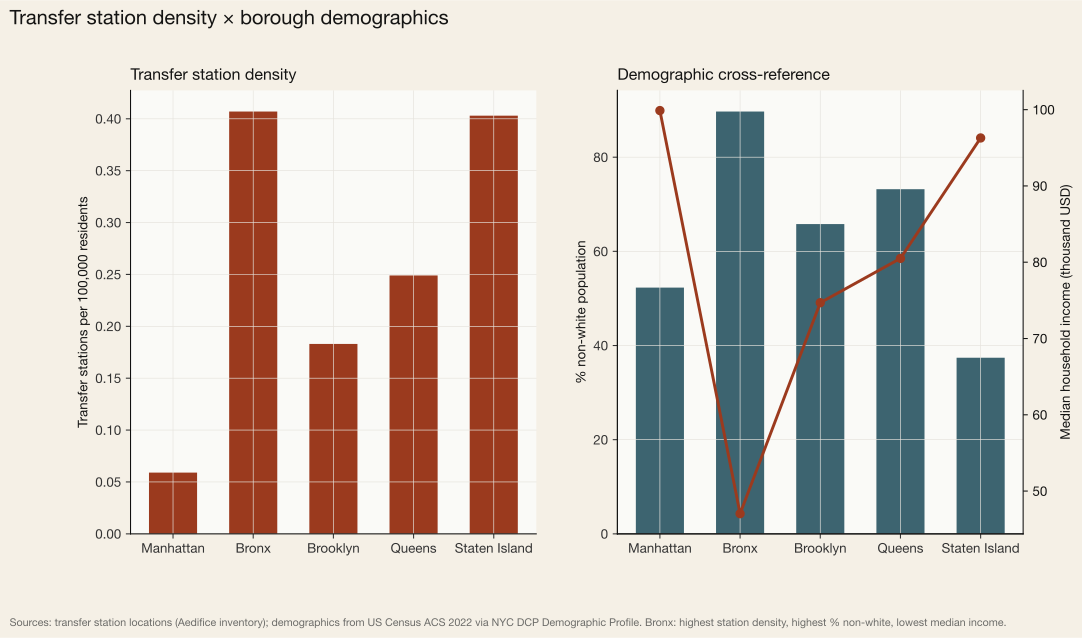
Every ton of MSW that leaves the city passes through a transfer station. An inventory of 20 representative facilities, compiled from the DSNY Solid Waste Management Plan (2006, as amended), New York State DEC Part 360 permits, and the NYC Environmental Justice Alliance's field survey, shows 6 facilities in the Bronx, 6 in Queens, and 5 in Brooklyn — concentrated in community districts 1 and 2 of the Bronx, CD 1 of north Brooklyn, and CD 2 of western Queens. Manhattan, which generates approximately 20% of the city's residential waste, hosts one transfer station (the DSNY-operated East 91st Street Marine Transfer Station, activated in 2019). The demographic composition of the host communities is a matter of public record: the Bronx is 89.7% non-white and has a median household income of $47,036; Manhattan is 52.3% non-white and has a median household income of $99,880. This report takes no editorial position on the distribution; the distribution itself is the finding.
5. The circularity gap is measurable.
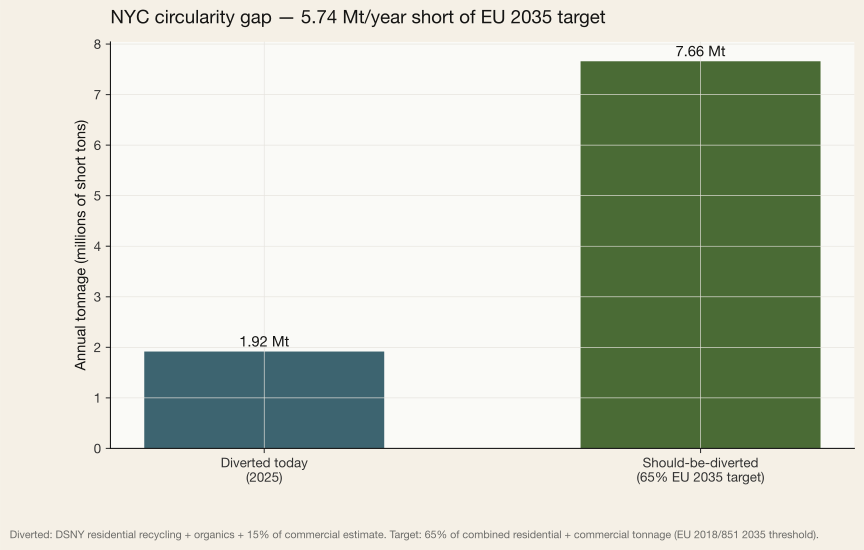
If 2025's residential and commercial tonnage is treated as the relevant denominator, and the EU Circular Economy Action Plan's 2035 target of 65% diversion is applied as the reference numerator, the city is running a circularity gap of approximately 5.74 million tonnes per year. The currently diverted portion — 16.3% of combined flow — is below the 55% EU 2025 threshold that became binding on member states in December 2025. Closing the gap is not a rhetorical target. It is a tonnage.
Where diversion happens
Construction and demolition debris
Transfer station geography
Demographic context
Residential versus commercial
Generation to destination
Against binding international benchmarks
The circularity gap, quantified
The commodity value of what is thrown away
Even narrowed to the residential stream, the diverted tonnage in 2025 has a measurable commodity value. Applying 2026 Q1 market prices — mixed paper at approximately $83 per metric tonne, steel scrap at $375, glass cullet at $33, and PET at $309 per tonne — to the diverted paper and MGP streams yields approximately $76.3 million of tradeable material processed annually through the city's MRFs. This figure is not a claim about MRF-floor prices (which depend on contamination, contract structure, and hauler gate fees) nor about net revenue after processing costs. It is a first-order measure of the commodity pool the circular model would be competing for. The figure does not include organics, textiles, or the substantially larger tonnage flowing through private commercial carters and DEC-permitted C&D processors.
What this means
1. The waste budget is a building budget.
Commercial waste is the largest single stream, not C&D. C&D accounts for roughly one-third of the combined total, behind commercial and ahead of residential. In the latest reported year, the shares split approximately 44.8% commercial, 35.7% C&D, and 19.5% residential. A circular-economy policy that engages only with the residential stream — curbside recycling, organics pilots, pay-as-you-throw pricing — is engaging with roughly one-fifth of the city's material flow. The larger material problem is the combined commercial-plus-demolition tonnage — and, as Chapter 1 of this report documents, a meaningful share of the demolition half comes from buildings that did not need to be replaced.
2. The public ledger is incomplete.
DSNY publishes residential tonnage monthly, by community district, for twenty-one years. BIC publishes a list of 520 licensed carters and 1,967 C&D registrants, and publishes violations; it does not publish tonnage by hauler. DEC Part 360 transfer-station permits record capacity but not throughput. A circular-economy program cannot be managed against flows it cannot observe. The first analytical prerequisite is routine tonnage reporting by licensed commercial haulers and by DEC-permitted C&D processors.
3. Geography concentrates burden; geography should concentrate accountability.
Transfer-station density is six times higher, per capita, in the Bronx than in Manhattan. The city's 2006 Solid Waste Management Plan, and the 2018 Waste Equity Law (Local Law 152), were explicit responses to this distribution. A materials audit of the network — tonnage, truck miles traveled, and host-community health indicators — is the logical complement to the capacity audits that LL 152 already requires. Neither this report nor any publicly available dataset currently resolves tonnage at the per-facility level with the granularity that policy analysis of LL 152 would benefit from.
4. The peer-city gap is a capacity gap, not a behavioral gap.
Amsterdam's 43% residential diversion and San Francisco's 60% are not the result of different residents. They are the result of different collection systems. Amsterdam's citywide source-separation of organics rolled out post-2018, extending an earlier low-rise program to the high-rise building stock that makes up most of the city. San Francisco implemented mandatory curbside organics in 2009. The infrastructure gap is the binding constraint. NYC's organics program has reached mandatory status in all five boroughs as of late 2024; the tonnage response — visible in the far-right edge of Figure 4.1 — will take several years to stabilize and should be the primary tracking indicator through 2030.
5. Building preservation is a waste-reduction policy.
The 5.9 Mt of C&D in a single recent year ranks among the larger urban C&D waste streams in the OECD on a per-capita basis (OECD municipal waste statistics). It is generated, almost entirely, by the decision to take buildings down. Chapters 1 and 2 establish that most NYC buildings do not reach end-of-service-life on engineering grounds. The waste they become when demolished is, therefore, substantially avoidable — a point already made in embodied-carbon terms in Chapter 1 and now extended in tonnage terms here. Preservation is not a cultural preference. It is the largest available lever for reducing a major share of the city's combined waste stream.
How to cite
Edwards, J. (2026). Building Prosperity in New York — Chapter 4: The Waste. Aedifice Research. Retrieved from https://aedifice-research.vercel.app/research/publications/building-prosperity/chapter-4-waste.