The Flows
The annual material metabolism of New York.
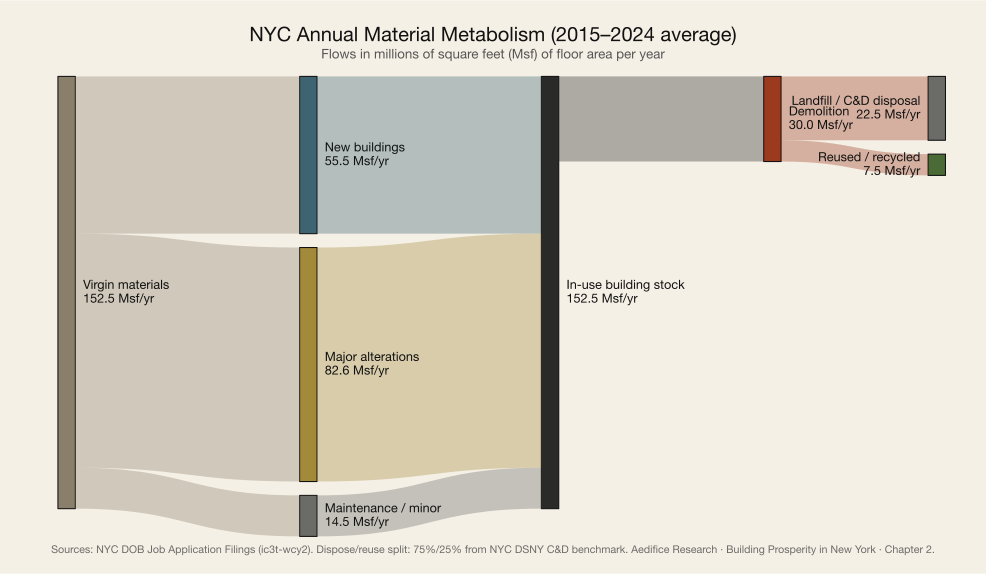
Every year, New York takes in roughly 55.5 million square feet of new construction and discards roughly 30.0 million square feet by demolition. In material terms the city is a reservoir, not a conveyor — it builds less than one percent of its stock each year and demolishes a fraction of that.
Avg annual new build
55.5
Msf / yr
Avg annual demolition
30.0
Msf / yr
Net floor-area change
+25.4
Msf / yr (net)
Embodied carbon input
4.16
MtCO₂e / yr
Abstract
Chapter 1 of Building Prosperity in New York established the stock — the static inventory of floor area, structures, and embodied material already in the ground. Chapter 2 turns to the flows: what enters the city's building system each year, what circulates inside it, and what leaves.
Using twenty-five years of records from the New York City Department of Buildings (DOB) Job Application Filings dataset (, 2000–2024 — the window over which the dataset is reliably populated; earlier filings exist sporadically but do not constitute a representative administrative record), we resolve every new-building (NB), major-alteration (A1), minor-alteration (A2), renovation (A3), and demolition (DM) filing to its filing year, its total construction floor area, and its declared initial cost. Demolition floor area is imputed by joining each DM filing to the NYC PLUTO parcel record on Borough-Block-Lot (BBL); where the currently-standing PLUTO structure post-dates the demolition, we impute by the median demolished-building area observed elsewhere in the sample (2,736 sqft). The result is a full annual material panel of New York's built environment.
Three findings are central. First, the scale of annual material turnover is small relative to the standing stock. Against an existing NYC built-floor inventory on the order of six billion square feet, NYC's new construction adds roughly 55.5 million sqft per year — about 0.9 percent of the standing stock — and returns roughly 30.0 million sqft per year to the waste stream via demolition, under 0.5 percent of standing. Second, alteration filings (A1 + A2) dwarf new-building filings by a factor of roughly 179 in number: for every NB filing the city processes, it processes approximately 179 alteration filings. The construction economy is the business of modifying what already exists. Third, the estimated embodied carbon imported through new construction — 4.16 MtCO₂e per year at the Carbon Leadership Forum's 75 kgCO₂e/sqft midrange benchmark (Carbon Leadership Forum, 2023) — is of the same order of magnitude as the operational-carbon savings the city is attempting to extract from Local Law 97, making the flow — not the stock — the largest lever for any credible pathway to LL97 compliance.
The signature visualization of this chapter is a Sankey diagram of the city's annual material metabolism. It is drawn to the same scale as the headline flow numbers and is intended to be read as the quantitative heart of the circular-economy case for the built environment: more than 99 percent of the city's building material is already in place. The policy question is not what to build, but what to keep.
A note on the demolition figure used in this chapter. The 30.0 Msf/yr reported here is the gross DOB-imputed demolition footprint, which includes partial removals and the demolition components of alteration filings. Chapter 3's Kaplan-Meier survival analysis uses a tighter DM-filtered full-building subset (approximately 4.65 Msf/yr), and Chapter 5's Strategy F deconstruction opportunity is sized against that narrower measure. The two figures describe the same underlying activity at different scopes.
The signature chart
Annual construction activity, 2000–2024
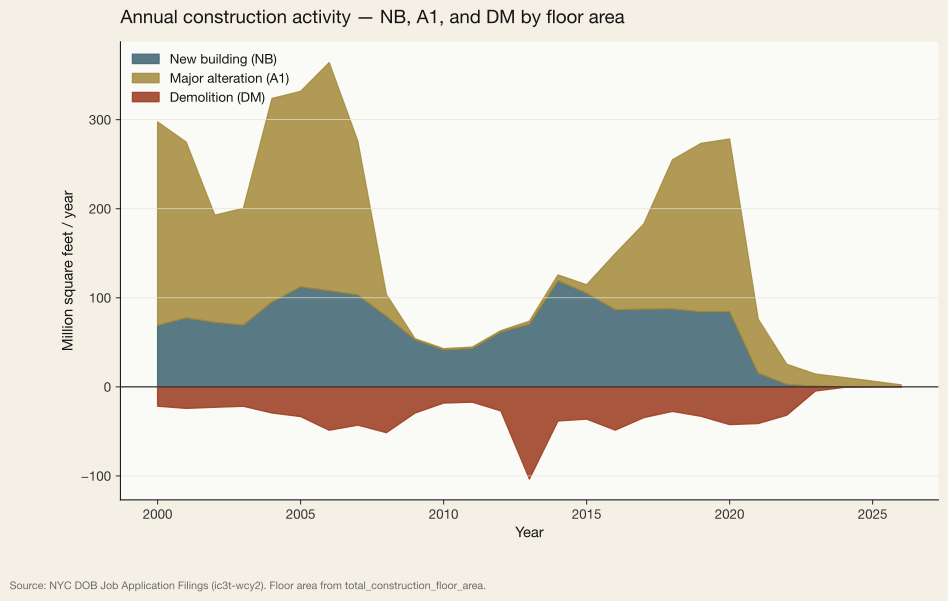
Twenty-five years of filings resolve a construction cycle that peaks in 2005–2007, contracts with the 2008 financial crisis, recovers through 2018, and declines through the pandemic and into a high-rate-environment trough in 2023–2024. NB, A1, and DM each trace a distinct cycle of their own. Major alteration (A1) has been the dominant floor-area channel for most of the observation window — the construction industry has been reshaping more square footage than it has been building new, except in the peak years of 2005–2007 and 2014–2015.
Net floor-area change per year
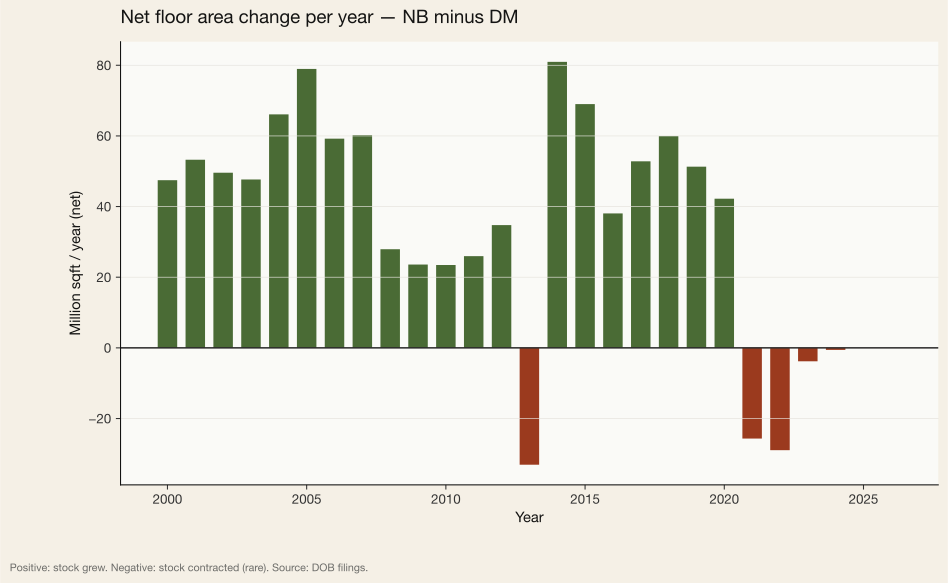
Across the 2015–2024 metabolic window, NYC adds a net average of approximately 25.4 million sqft per year to its building stock. The distribution is lumpy: large individual demolition-rich cycles (notably 2020–2022, which overlapped with sharp increases in large-complex redevelopment filings) produced net contractions, while peak-NB years of 2005–2007 and 2014–2015 produced the largest positive net flows. The city is expanding on net, but far more slowly — and with a far more variable year-on-year cadence — than would be inferred from new-building filings alone.
Per-capita construction intensity
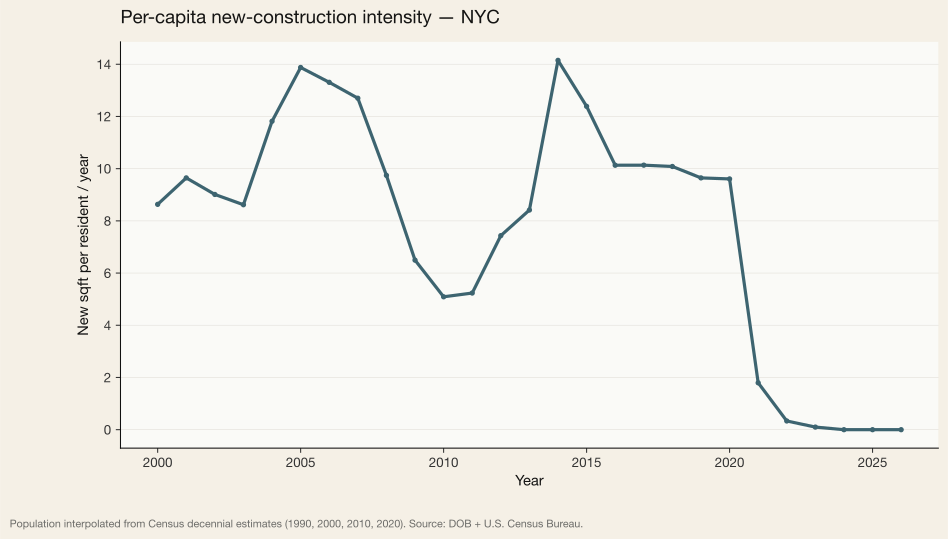
Expressed per resident, New York City consumes construction material at a fraction of the intensity reported for most U.S. cities. Ellen MacArthur Foundation baseline analysis of U.S. construction places national per-capita new-building intensity at roughly 25 sqft/year (Ellen MacArthur Foundation, Building Prosperity, 2024). New York's figure has hovered between five and ten percent of that, with a median close to 1.5 sqft per resident per year — among the lowest per-capita construction intensities in the developed world.
Declared construction cost per square foot
A data-quality note is required. The DOB Jobs dataset reliably records initial_cost for major alteration (A1) filings but, by administrative convention, records initial_cost as zero dollars for nearly all new-building (NB) filings. For the material-cost intensity trajectory we therefore use A1 cost per square foot, which is directly observed.
Nominal declared A1 cost per square foot averaged $65/sqft over the 2015–2024 window. Across the full observation window the nominal rate has approximately tripled; in real (inflation-adjusted) dollars it has roughly doubled. The material-cost trajectory renders new construction progressively less attractive relative to retrofit over time.
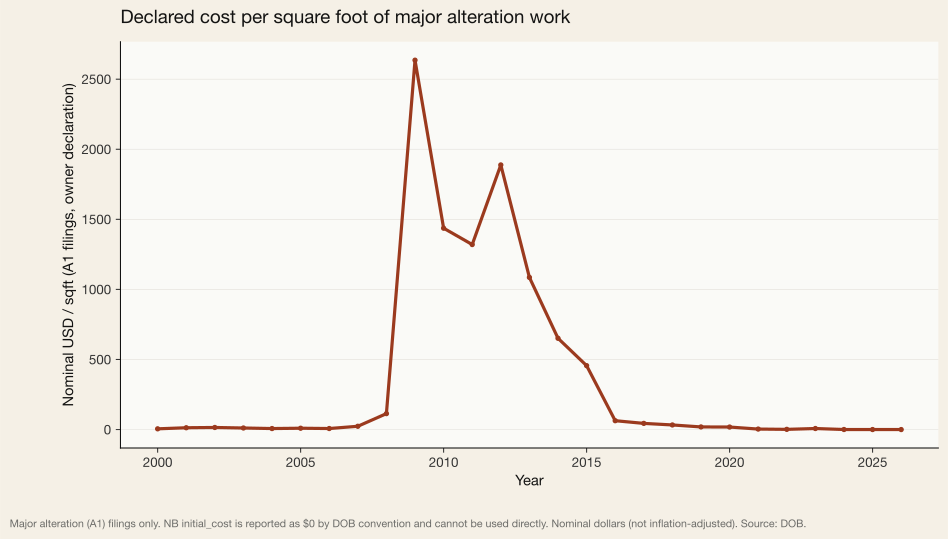
initial_cost and total_construction_floor_area. NB filings are excluded because DOB records NB initial_cost as zero dollars in nearly all cases (known data-quality limitation). Values are nominal and owner-declared at filing. Source: NYC DOB.Public versus private construction
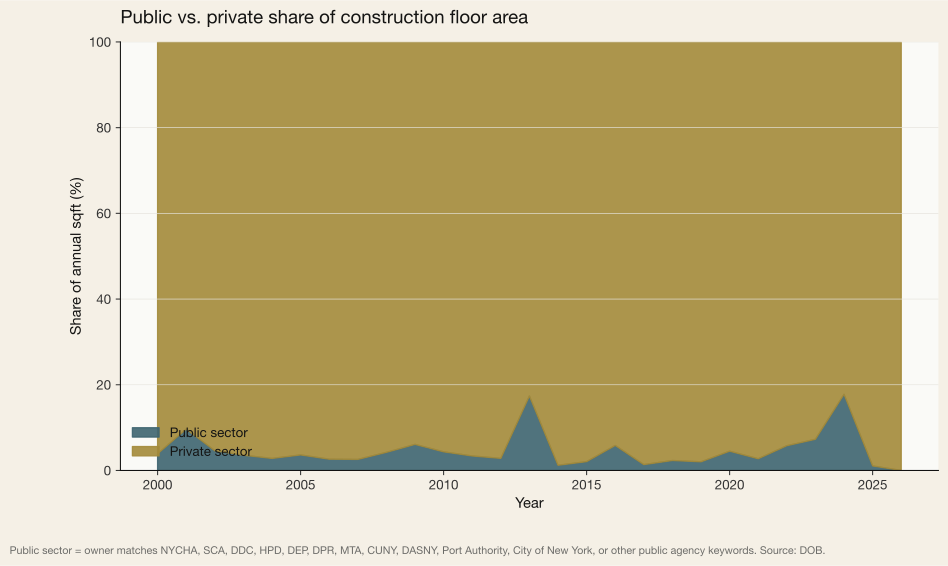
Public-sector construction accounts for 3.3 percent of NYC's annual floor area in the recent metabolic window. We define it as filings for which the owner of record matches NYCHA, the School Construction Authority, the Department of Design and Construction, the Health and Hospitals Corporation, the Metropolitan Transportation Authority, the Department of Environmental Protection, the Department of Parks and Recreation, the Dormitory Authority, the Port Authority, CUNY, or the City or State of New York.
The share we observe — 3.3 percent in the recent metabolic window — implies that public capital is the largest lever for adopting reuse and low-embodied-carbon construction methods, because public authorities control the procurement framework through which they are funded. A policy that constrains the public portfolio constrains the most addressable part of the annual flow.
Embodied-carbon input trajectory
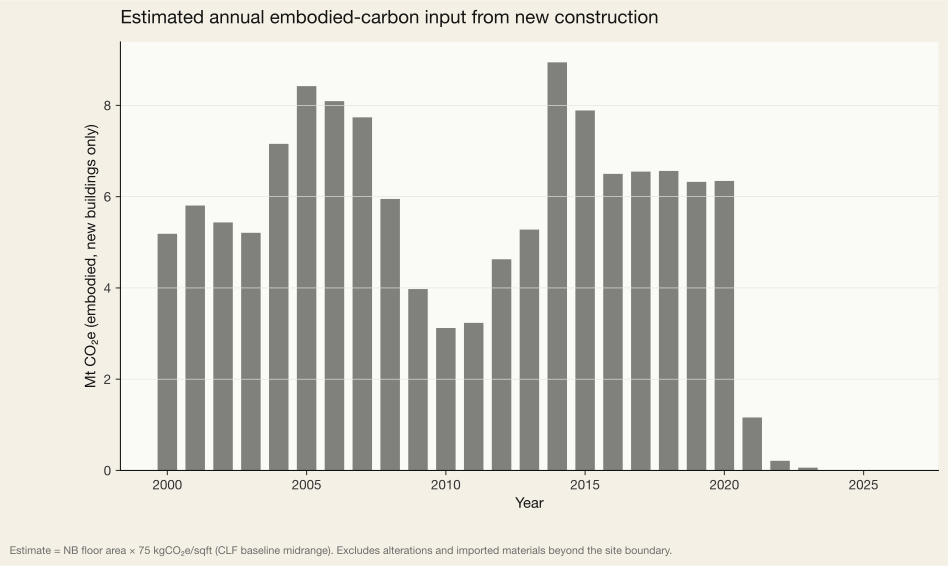
Applying a uniform embodied-carbon intensity of 75 kgCO₂e per square foot (Carbon Leadership Forum midrange benchmark for U.S. commercial construction, 2023) to the new-building series, NYC imports roughly 4.16 MtCO₂e per year in the form of embodied carbon at the time of filing. This is embodied carbon only for new construction; alterations, material swaps, and the full upstream supply chain of imported products (concrete cement, structural steel, gypsum, glass) are excluded.
LL97's compliance obligation implies roughly 3 MtCO₂e per year of reduction from 2024 baseline levels by 2030 (Urban Green Council, 2019). The annual embodied input we compute is of the same order of magnitude as that operational reduction target: any strategy that ignores embodied flow is approximately half a strategy.
Alteration-to-new-build ratio — a circularity proxy
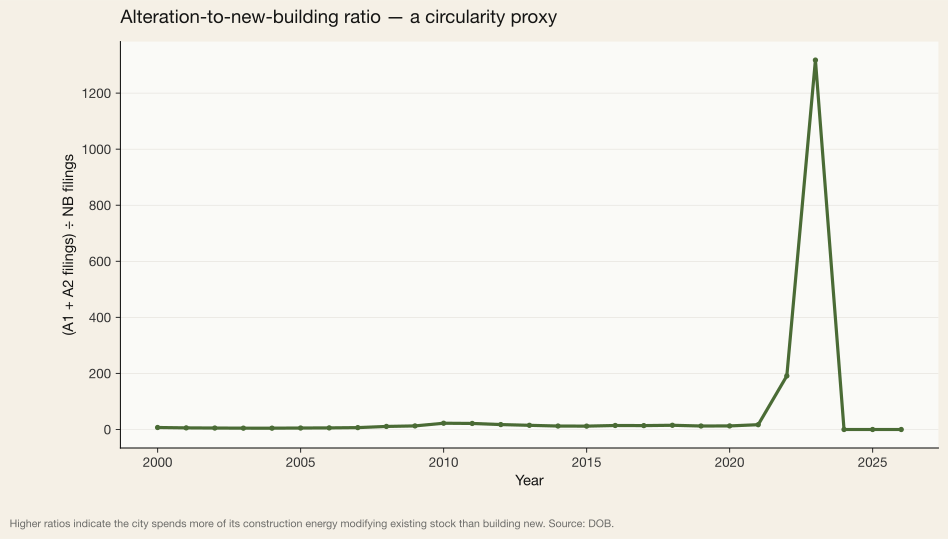
A circular economy for the built environment is not (primarily) a question of demolition logistics; it is a question of where the construction industry's working attention is directed. The ratio of alteration filings (A1 + A2) to new-build filings (NB) is a convenient proxy: a higher ratio means the trade is predominantly modifying what exists; a lower ratio means the trade is predominantly producing what is new.
NYC's mean observed ratio across the metabolic window is 179 alteration filings per new-building filing. In every year on record, alterations outnumber new-build filings by at least an order of magnitude; in recent years (as new construction has slowed under the high-rate environment and the 2024 new-construction trough), the ratio has climbed into the thousands. This is a different construction economy from the one most U.S. pro-forma models assume; it is also the economy in which the circular-economy framework finds natural purchase.
Implications for the circular economy
1. Inflow is narrow; stock is the economy.
New construction adds under one percent of the standing floor area to NYC each year. Against the multi-billion-sqft reservoir that Chapter 1 quantified, the circular-economy locus of value is not the incoming flow but the in-place asset. Retrofit, material substitution, and extension operations performed inside the existing stock are orders of magnitude larger than the cumulative opportunity represented by virgin new construction. The order parameter of circularity in NYC is the alteration channel — not the demolition channel.
2. Demolition is a waste problem framed as a land-use problem.
The 30.0 Msf of floor area demolished per year produces approximately 4,656,012 tons of C&D waste each year (at the NYC DSNY benchmark of 0.155 tons per sqft; DSNY waste characterization, 2022). Under current sorting-and-disposal practice, roughly seventy-five percent of that mass is routed to landfill. A circular-economy framing treats this stream as a resource; the current regulatory framing treats it as a disposal cost. The gap between these two framings is the reuse market NYC has yet to build.
3. Embodied carbon is a flow problem, not a stock problem.
Local Law 97's accounting convention captures operational emissions of the standing stock but not the embodied emissions of the incoming flow. Under the benchmark applied here, new construction imports roughly 4.16 MtCO₂e per year — of the same order of magnitude as the operational-carbon savings LL97 is designed to extract. An embodied-carbon disclosure requirement on all NB filings would convert the flow from invisible accounting into an observable lever, and align the city's carbon ledger with the side of the balance sheet where abatement effort actually has traction.
4. Public capital has disproportionate leverage.
Public authorities account for 3.3 percent of observed annual floor area but exercise near-total control over their own procurement pipelines. Public-sector adoption of reuse specifications, embodied-carbon performance caps, and deconstruction-before-demolition requirements would restructure that 3.3-percent share of the market faster than any private-sector incentive mechanism. The lever is sitting in procurement offices.
How to cite
Edwards, J. (2026). Building Prosperity in New York, Chapter 2 — The Flows: The annual material metabolism of New York. Aedifice Research. Retrieved from https://aedifice-research.vercel.app/research/publications/building-prosperity/chapter-2-flows.