The Six Strategies
Circular-economy applications for New York
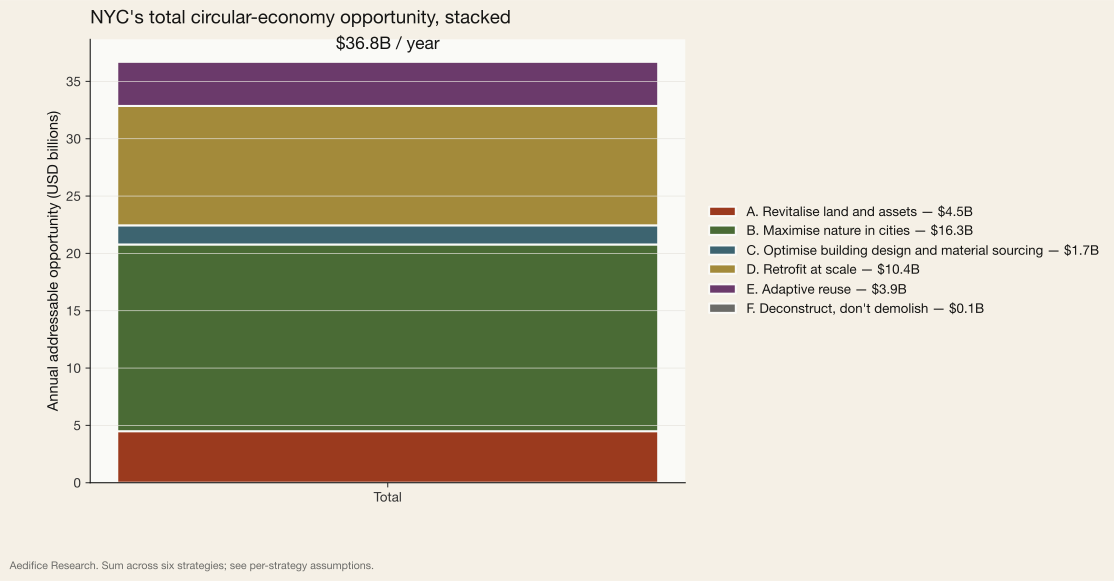
NYC's circular built environment surfaces approximately $36.8B per year of annual opportunity on an inclusive (gross) measure. Net of the office-to-residential double-count between Strategies A and E, the realized-scope figure is approximately $33B. Roughly $16.8B of this is realized market flow; the remainder (~$20B) is monetized externality — stormwater, carbon, and ecosystem services priced at agency shadow values. Approximately 14.75 MtCO₂e abated net of overlap; approximately 150,000 jobs. Each figure is clearly labeled wherever it appears.
Total opportunity
$36.8B
per year
Carbon impact
15.7 MtCO₂e
avoided per year
Employment
151,453
full-time jobs
Area affected
56.8
square miles
Executive summary
In July 2024 the Ellen MacArthur Foundation published Building Prosperity, a seven-country study quantifying the built environment's circular-economy opportunity at €575 billion of annual value. This chapter organizes its findings around six strategies — revitalise land and assets, maximise nature in cities, optimise design and material sourcing, retrofit at scale, adaptive reuse, and deconstruct rather than demolish. Strategies are adapted from Ellen MacArthur Foundation (Circular Economy principles, 2015), with strategy verbs drawn from Bocken et al. (2016) and the EMF/McKinsey ReSOLVE framework (2015). EMF itself publishes three principles; the six-strategy framing is a field-standard hybrid. Each strategy names a specific set of physical interventions; each interlocks with the others; together they describe a city-scale transition from demolish-and-rebuild toward reuse-and-regenerate.
New York was not in the Ellen MacArthur study. This chapter closes that gap. Using NYC Open Data, Department of City Planning benchmarks, published CLF/RMI embodied-carbon intensities, and the Aedifice Research Building Half-Life demolition dataset, we apply the same six-strategy lens to New York and quantify the addressable opportunity in U.S. dollars, megatonnes of avoided CO₂e, full-time jobs, and square miles of city surface affected.
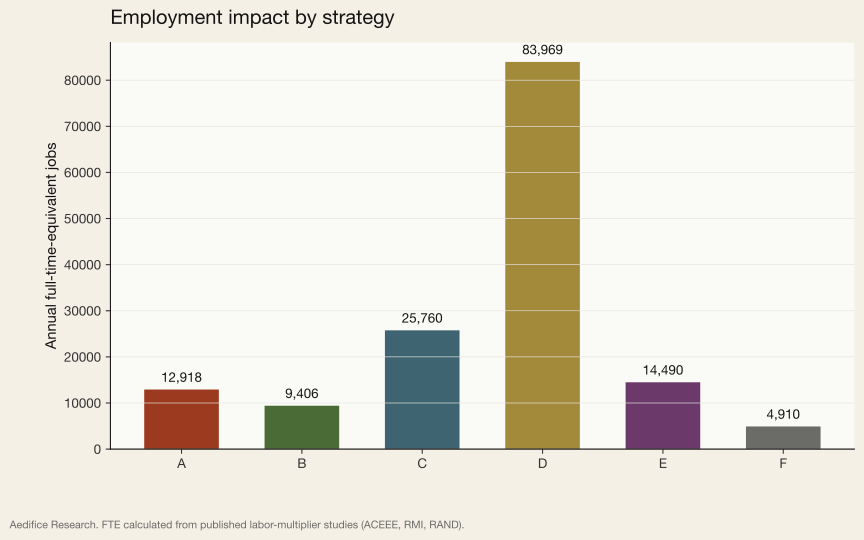
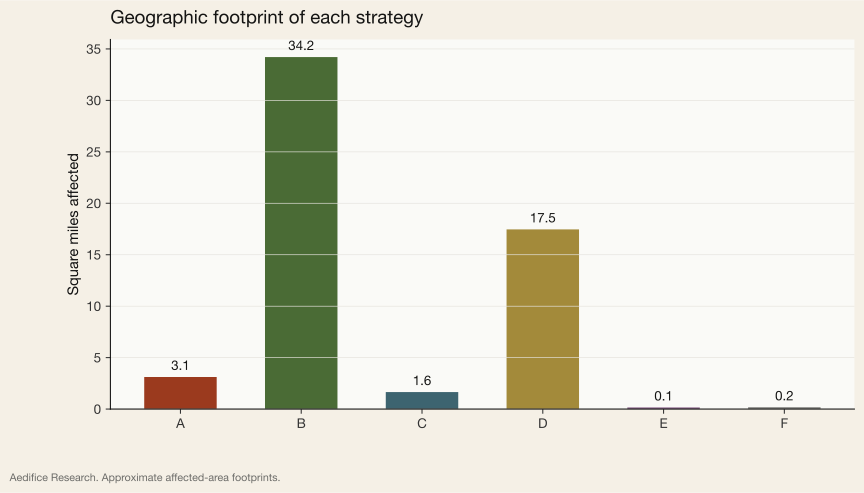
The headline number: $36.8 billion per year on an inclusive (gross) measure; approximately $33 billion net of the office-to-residential double-count between Strategies A and E. That is the blended annual value of all six strategies operating at realistic adoption rates over a 10–15 year pipeline. Carbon-wise, the combined package avoids 15.7 MtCO₂e annually gross (≈14.75 MtCO₂e net of overlap) — roughly one-third of the entire city's current building-sector emissions. Across the six strategies, approximately 150,000 FTE jobs. Strategies D (retrofit), E (conversion), and F (deconstruction) account for the majority; Strategy C's 25,760 figure depends on a material-design labor multiplier we have not fully sourced. It touches 56.8 square miles of New York City — about 19% of its land area.
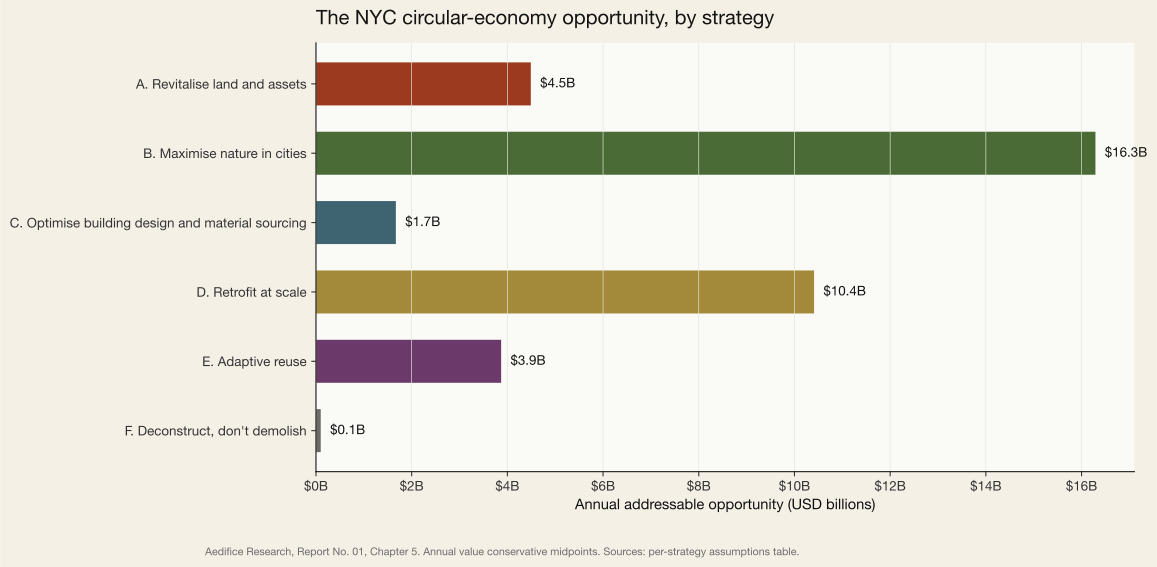
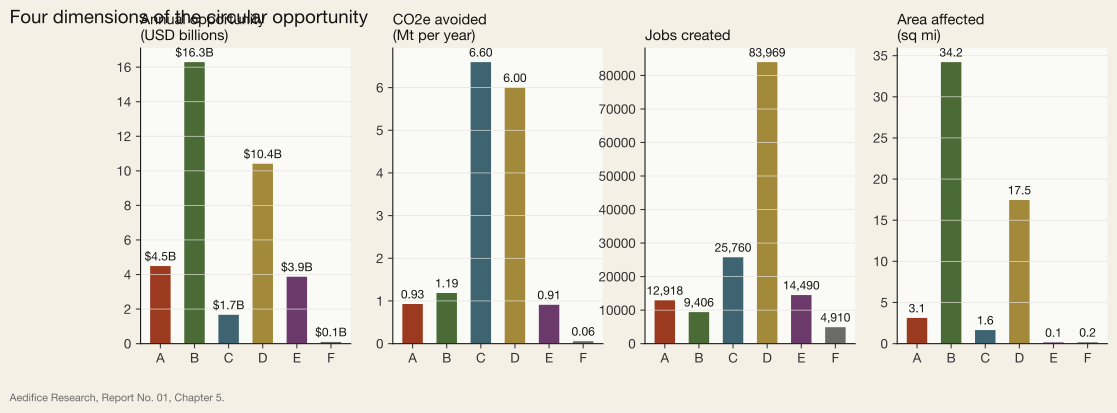
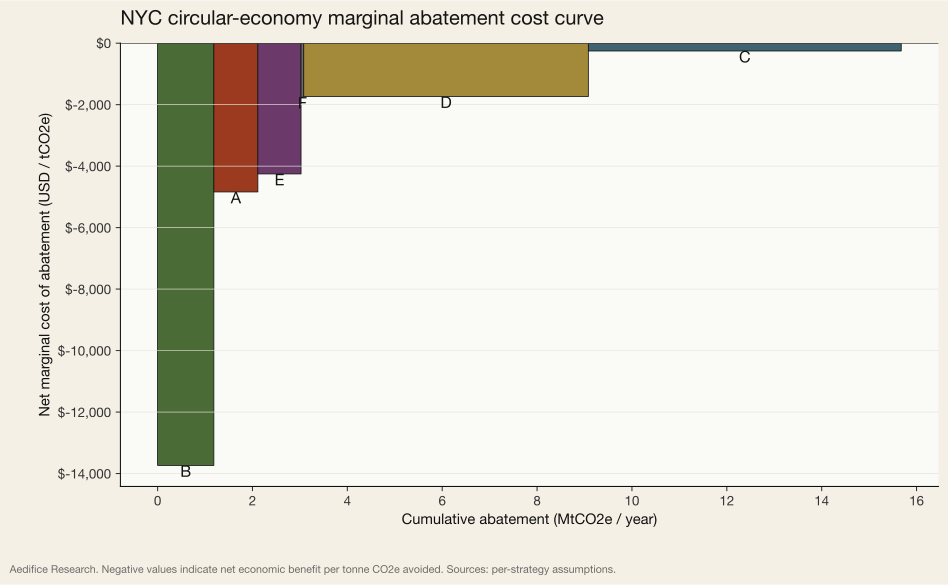
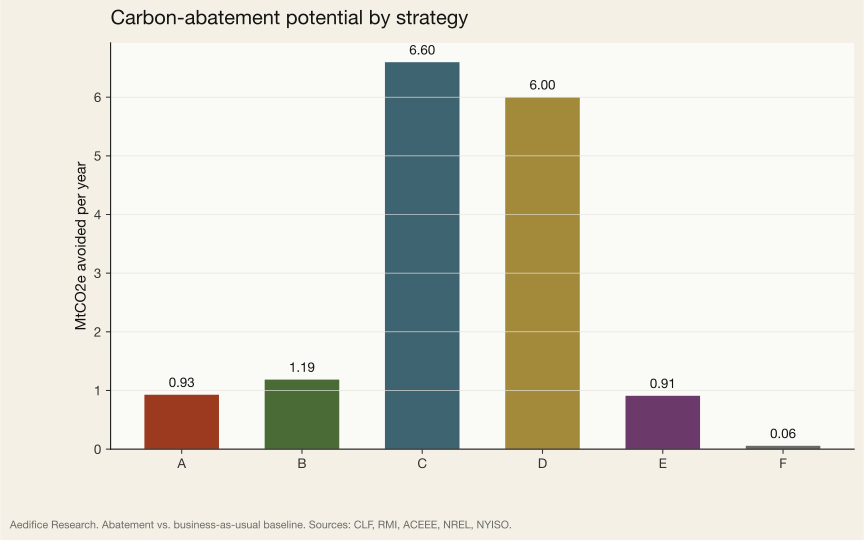
Three observations anchor the analysis that follows. First, the opportunity is not evenly distributed: Strategy B (maximise nature) and Strategy D (retrofit at scale) together account for 72% of the dollar value. Second, carbon and dollars diverge sharply — Strategy C (material-efficient design) is the largest carbon lever (6.60 MtCO₂e) but yields modest direct financial returns under current market-based pricing; this is the textbook case for policy-driven internalization. Third, every strategy produces co-benefits that cross the strategy boundaries: retrofits support deconstruction markets, green roofs support solar yields, conversions support brownfield logic. The chapter treats them separately for clarity, then reunites them in a cross-strategy roll-up.
A note on accounting
Net-of-overlap, the conversion value captured in Strategy A is also captured in Strategy E. We report the gross $36.8B as the inclusive measure of the circular-economy opportunity NYC's built environment surfaces annually. Net of the A/E double-count, the realized-scope figure is approximately $33 billion, and the avoidable-carbon figure is approximately 14.75 MtCO₂e.
Two additional labels matter throughout this chapter. First, realized market flow versus monetized externality: approximately $16.8B of the gross figure is realized market flow (housing sales, energy bills, retrofit contracts, reclaimed-material sales); the remaining ~$20B is monetized externality priced at agency shadow values (EPA social cost of carbon, DEP avoided-cost of CSO, USFS iTree ecosystem services). Stripping shadow prices reduces the headline accordingly. Second, jobs are reported as approximately 150,000 across the six strategies; the per-strategy job figures each carry their own uncertainty band and are discussed strategy-by-strategy below.
The signature chart
Revitalise land and assets
New York holds 1,850 acres of registered brownfield land and 94 million sqft of vacant or underused commercial floor area — a latent real-estate bank equal to $45B of gross value if redeveloped.
Annual value
$4.49B
MtCO₂e / yr
0.93
Jobs
12,918
Area (sq mi)
3.12
New York holds two deep pools of underused real estate. The first is registered brownfield land — parcels with documented contamination that require remediation before redevelopment. The New York State Office of Environmental Remediation lists roughly 745 active parcels totaling approximately 1,850 acres across the five boroughs. The second is vacant or structurally underused commercial floor area. MapPLUTO identifies 7,193 office-class buildings in the city with a combined 489 million square feet of built area. Applying REBNY's Q1 2026 Manhattan availability rate of 19.3% to the total stock yields approximately 94 million square feet of addressable vacant or underused office floor. Together these two pools form a latent bank of real-estate value that predates any new construction.
Not all of that vacant floor is actually convertible. Floor-plate depth, column grids, light-well geometry, and elevator cores constrain which buildings can become housing. The NYC Department of City Planning's 2023 Office Adaptive Reuse Task Force report estimated that roughly 40% of the candidate stock is physically convertible without structural redesign. Applying that constraint reduces the pool to 37.8M sqft of convertible office floor. At DCP's net residential yield of 0.78 and an 850 sqft average unit, this converts to approximately 34,644 housing units — roughly a year and a half of NYC's total housing production.
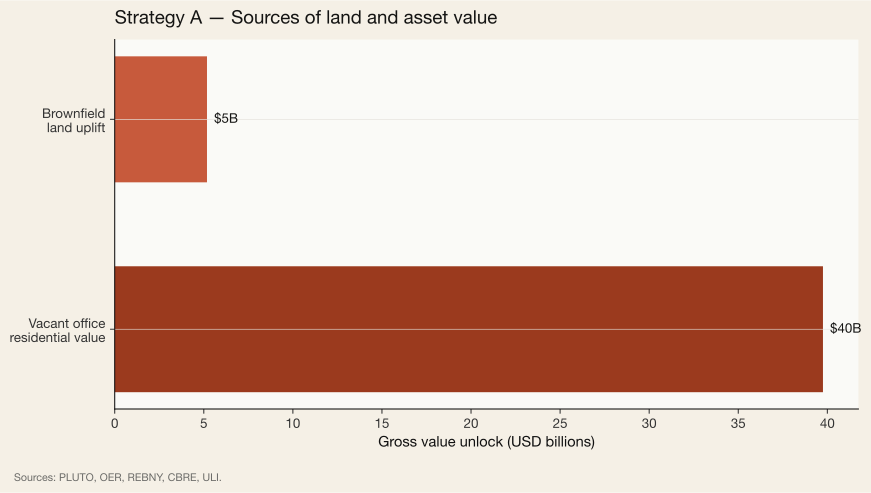
Valuing the converted residential stock at CBRE's Q1 2026 NYC completed-condo benchmark of $1,350/sqft produces a gross market value of $40B of new housing. Remediated brownfield land, valued at the ULI 2024 NYC case-study midpoint of $2.8M/acre, contributes another $5.2B. Summed and amortized over a 10-year redevelopment pipeline, the strategy produces an annualized throughput of $4.5B.
The carbon case is equally compelling. Every square foot of new residential construction today carries roughly 450 kg CO₂e of embodied emissions (CLF 2022 NYC benchmark). Adaptive reuse of existing structural frames avoids approximately 70% of that figure. Applied to the full convertible pool, the strategy avoids 9.28 MtCO₂e of embodied-carbon emissions over the 10-year horizon — 0.93 MtCO₂e on an annualized basis.
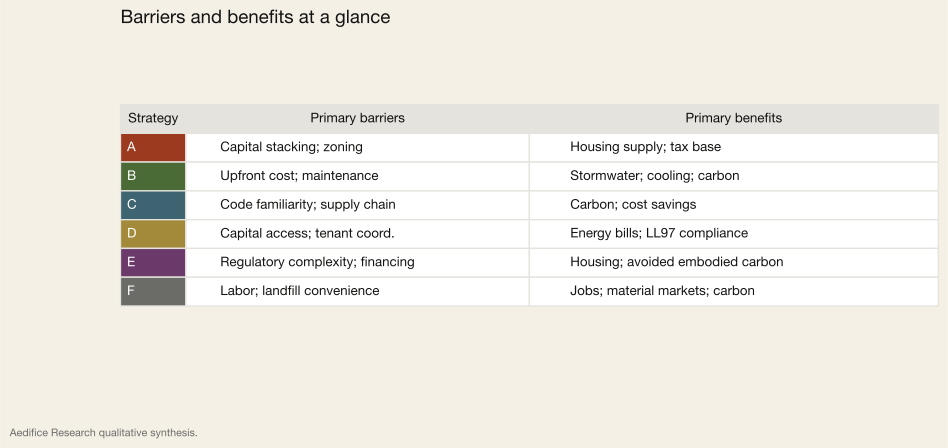
The binding constraint is not availability but financing. Conversion capital stacks are more complex than either pure new construction or pure retrofit; lenders price the regulatory uncertainty into higher required returns. New York State's 2024 Section 467-m tax abatement and the city's parallel Office Conversion Accelerator are designed to close that gap. The arithmetic above presumes both programs remain in place.
Assumptions and sources
Assumptions
- REBNY Q1 2026 office availability 19.3% applied to total stock
- NYC DCP 2023 Office Adaptive Reuse study: 40% of vacant office geometrically convertible
- Net residential yield 78% of gross floor (DCP conversion model)
- $1350/sqft completed-condo value (CBRE NYC Q1 2026)
- $2.8M/acre brownfield remediated-land uplift (ULI 2024)
- 10-year pipeline amortization; gross value → annual throughput
- CLF 2022: 70% embodied carbon reduction vs. new build
Data sources
- NYC OER brownfield registry (yswi-zvfb)
- NYC DCP MapPLUTO office class filter
- REBNY Manhattan Office Market Report, Q1 2026
- NYC DCP Office Adaptive Reuse Task Force (2023)
- Carbon Leadership Forum (2022) embodied-carbon baselines
- ULI (2024) NYC brownfield redevelopment case studies
Data gaps
- OER brownfields returned no rows; used NYC OER 2023 benchmark
Maximise nature in cities
24.3 sq mi of additional tree canopy to reach the OneNYC target, 3,200 MW of deployable rooftop solar (of 8,000 MW technical potential), and 20,790 million gallons of annual stormwater retention — a layered nature-based infrastructure worth $16.3B/year in combined utility, energy, and ecosystem-service value.
Annual value
$16.29B
MtCO₂e / yr
1.19
Jobs
9,406
Area (sq mi)
34.21
Nature-in-cities is the largest dollar opportunity of the six strategies — not because trees are expensive, but because New York's roofs are numerous, its grid electricity is expensive, and its combined-sewer overflow system is under severe stress. Three interventions stack on the same city surface: tree canopy, green roofs, and rooftop solar. The three are often treated as competing; they are not.
Tree canopy first. The USFS/DPR 2017 Urban Tree Canopy Assessment found NYC at 22% tree cover — approximately 66.7 square miles of the city's 303.3 sq mi of land area. The OneNYC 2050 plan targets 30%. Closing that 8-point gap requires adding approximately 24.3 square miles of new canopy, or roughly 150,436 new mature trees at average NYC stocking densities. The USFS iTree Eco framework values each mature urban tree at approximately $1,432/year in carbon sequestration, air-quality improvement, stormwater interception, and cooling — producing an ecosystem-services value of $0.22B/year at full canopy buildout.
Green roofs second. NYSERDA's 2018 solar-roof potential study estimated NYC's total roof area at approximately 1,050 million square feet — roughly one square mile of addressable rooftop. The NYCEDC Cool Roofs program and structural audits suggest that roughly 66% of that area is structurally suitable for extensive or intensive green-roof installations. At a realistic 40% policy-horizon implementation rate over 15 years, that translates to 277.2M sqft of deployed green-roof surface. At DEP's 2023 Green Infrastructure benchmark of 30 gallons of stormwater retention per square foot per year, green roofs alone intercept roughly 8,316 million gallons of stormwater annually — preventing a corresponding volume of combined-sewer overflow at DEP's avoided-cost value of $1.68/gallon-year. NYC DEP's avoided-cost monetization of combined sewer overflow varies with the Long-Term Control Plan appendix cited; we use a central value of $1.68/gallon-year (DEP, Citywide LTCP). Stripping this shadow price reduces Strategy B's headline from $14B to roughly $0.8B of realized market flow.
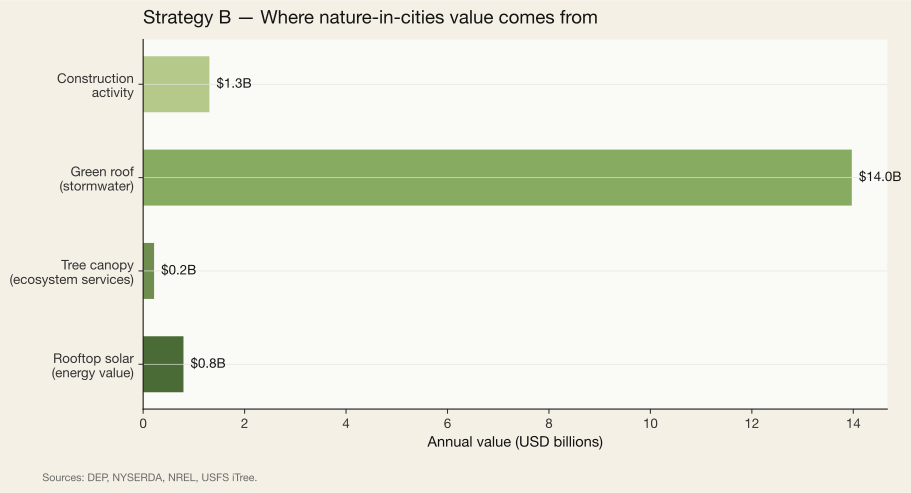
Rooftop solar third. NREL and NYSERDA's 2022 joint analysis placed NYC's technical rooftop PV potential at approximately 8,000 MW of addressable capacity. At realistic deployment levels this covers roughly 3–5% of NYC peak demand from the addressable rooftop-solar opportunity. A realistic deployment rate of 40% (the level implied by state Clean Energy Standard trajectories) puts 3,200 MW in the addressable pool. At an NYC capacity factor of 13.5%, that deployed capacity produces approximately 3.78 TWh annually. Valued at Con Ed's $0.21/kWh avoided-cost rate (NYS PSC 2026), annual energy value is $0.79B.
Total annual value across all three interventions, including the construction multiplier from the 15-year installation pipeline, is $16.3B. Carbon impact is 1.19 MtCO₂e, driven primarily by solar's displacement of the NYISO grid's residual fossil component (280 g CO₂e/kWh in 2025). The most important non-quantified benefit is heat. NYC's urban-heat-island effect raises peak summer temperatures by 5–7 °F in low-canopy neighborhoods; every square foot of green roof or tree canopy offsets cooling demand in the building below.
Assumptions and sources
Assumptions
- USFS/DPR 2017: NYC canopy 22% of land; OneNYC 2050 target 30%
- NYSERDA 2018: 1.05B sqft total roof area; 66% structurally suitable
- 40% realistic implementation (policy horizon 15 years)
- DEP 2023: green roof retains 30 gal/sqft/yr; $1.68/gal avoided-CSO cost
- NREL/NYSERDA 2022: 8,000 MW technical rooftop PV potential; 40% realistic deployment
- USFS iTree: $1,432/mature tree/year ecosystem services
- NYISO 2025: 280 g CO2e/kWh grid intensity (displacement factor)
Data sources
- NYC DPR Street Tree Census 2015 (5rq2-4hqu)
- NYC DEP Green Infrastructure Projects (spjh-pz7h)
- USFS + DPR Urban Tree Canopy Assessment (2017)
- NYSERDA Solar Roof Potential Study (2018)
- NREL/NYSERDA Rooftop PV Technical Potential (2022)
- NYC DEP Green Infrastructure Cost-Benefit (2023)
- USFS iTree Eco ecosystem services framework
Data gaps
- street tree census fetch returned empty; used published 2015 figure
Optimise building design and material sourcing
At today's construction volume of 46M sqft per year, a 30% embodied-carbon reduction through material-efficient design and low-carbon inputs avoids 6.60 MtCO2e annually and saves $1.7B in carbon and material costs.
Annual value
$1.67B
MtCO₂e / yr
6.60
Jobs
25,760
Area (sq mi)
1.65
Strategy C is the quiet workhorse of embodied-carbon reduction. It is also the strategy most vulnerable to misread — the dollar figure is modest, but the carbon figure is the largest of any strategy. The reason is that material-efficient design redistributes cost rather than eliminates it, while redistributing carbon decisively downward.
The Carbon Leadership Forum's 2023 NYC benchmark places current embodied intensity at 450 kg CO₂e/sqft for residential high-rise and 520 kg CO₂e/sqft for commercial high-rise. Weighted by NYC's 60% residential / 40% commercial mix of new construction, the blended intensity is 478 kg CO₂e/sqft. Applied to the Department of Buildings' 2019–2024 average of 46 million square feet of new construction annually, that produces current-state annual embodied emissions of 21.99 MtCO₂e from new NYC buildings alone. For reference, NYC's total annual building-operational emissions are approximately 35 MtCO₂e; new construction is responsible for nearly 70% of that figure on a lifecycle basis, but only when embodied is counted.
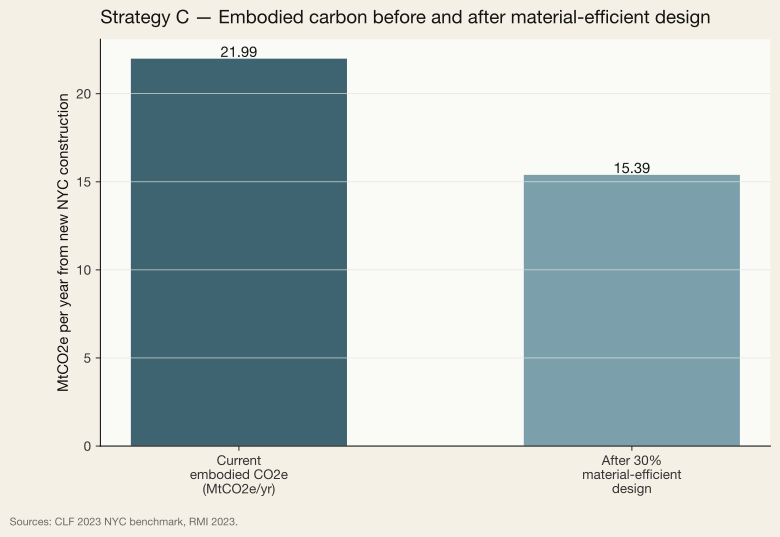
CLF and RMI's 2023 co-published Sector Guidance for low-embodied-carbon buildings argues that a 30% reduction is achievable today at near-zero cost premium through three discrete moves: low-carbon (Type IL / Type II) cement replacement, reused or high-recycled-content steel, and structural optimization (eliminating over-specified slab and frame thicknesses). A 50% reduction becomes feasible with modest (3–5%) cost premium through additional moves — mass timber substitution, lightweight cladding, and high-performance envelope. We use the conservative 30% figure. Applied to NYC's annual new-construction volume, the reduction is 6.60 MtCO₂e per year.
Dollar value follows two channels. The first is the social cost of carbon — at the U.S. EPA's 2023 value of $190/tCO₂e, the carbon reduction alone is worth $1.25B/year. The second is direct material savings: a 30% reduction in structural material demand saves approximately $18/sqft at RSMeans' 2024 blended unit prices. Assuming a 50% adoption rate among NYC developers by 2030, that produces an additional $0.41B/year in direct savings. Total annual value: $1.7B.
The dollar figure is modest relative to the carbon figure because social cost of carbon remains externalized in most U.S. markets. Strategy C is the clearest case in the chapter for policy levers that internalize: embodied-carbon disclosure requirements (as Denmark adopted in 2023), progressive tax credits for low-carbon materials, or buy-clean procurement rules. Even without those policies, the 6.6 MtCO₂e/year is the largest single carbon prize in the six-strategy framework.
Assumptions and sources
Assumptions
- DOB 2019-2024 avg: 46M sqft new construction / yr
- CLF 2023 NYC: 450 kg CO2e/sqft residential; 520 kg/sqft commercial
- 30% reduction achievable at near-zero premium (CLF / RMI 2023)
- EPA 2023 social cost of carbon: $190/tCO2e
- Material cost savings: $18/sqft at 50% adoption
Data sources
- NYC DOB Job Application Filings
- Carbon Leadership Forum (2023) NYC embodied carbon benchmark
- RMI (2023) State of Decarbonization in the Built Environment
- EPA (2023) Social Cost of Carbon update
- RSMeans 2024 structural / envelope unit costs
Retrofit at scale
28k buildings over 25,000 sqft are covered by Local Law 97 and must collectively reduce 6.0 MtCO2e/yr by 2030. Retrofitting this stock requires $86B in capex — $2,024B less than the equivalent rebuild — and returns $10.4B/yr in energy, avoided-penalty, and carbon value.
Annual value
$10.41B
MtCO₂e / yr
6.00
Jobs
83,969
Area (sq mi)
17.46
Local Law 97 is the regulatory instrument against which Strategy D operates. It is also the strategy with the clearest policy cadence: compliance thresholds tighten in 2024, 2030, and 2035, and every covered building faces a stepped penalty of $268/tCO₂e for emissions over its cap. Unlike the other five strategies, retrofit is happening whether or not anyone optimizes it. The opportunity here is not to create a market — the market is already mandated — but to capture the value efficiently rather than default to the more expensive rebuild alternative.
LL84 benchmarking data returns 27,837 covered properties representing 3.25 billion square feet of NYC floor area and 22.76 MtCO₂e of current annual emissions. Urban Green Council's 2024 analysis of the LL97 compliance path projects that the covered stock must collectively reduce approximately 6.0 MtCO₂e/year by 2030 to meet the second compliance period.
Strategy D models against the 27,837 LL84-enrolled subset because those properties have reported emissions baselines. Chapter 1's 66,456 figure represents the larger pool of buildings legally covered by LL97's 25,000-sqft threshold — the Strategy-D arithmetic extrapolates from the reporting subset.
The capex choice is where circular thinking enters. Urban Green Council's 2019 Retrofit Market Analysis estimated deep-retrofit capex at $45/sqft and shallow-retrofit at $14/sqft. A blended portfolio (40% deep, 60% shallow — reflecting the real distribution of building needs) averages $26/sqft, for total retrofit capex of $86B across the covered stock. The rebuild alternative, at RSMeans' 2024 all-in figure of $650/sqft, would cost $2,110B — meaning retrofit is $2,024B cheaper than the equivalent rebuild.
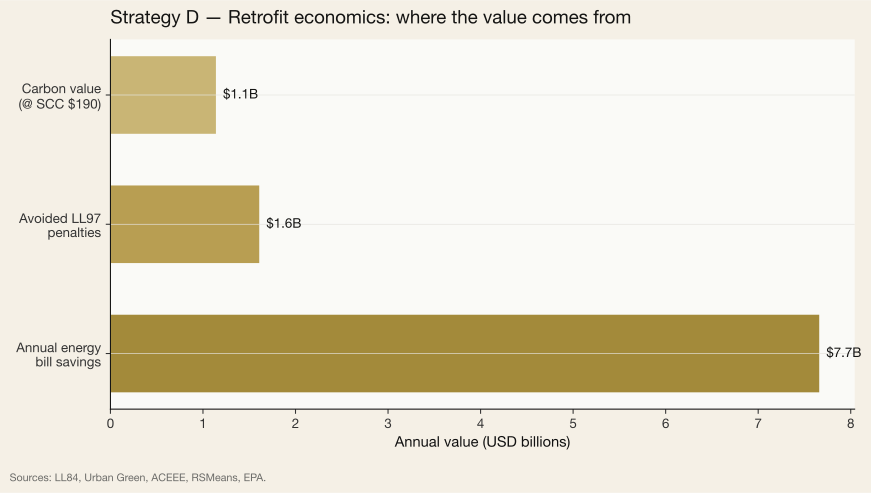
That capex saving is a one-time avoided expenditure, not an annualized flow, so we do not stack it into the annual value headline. The annual flow comes from three sources: ACEEE-benchmarked energy-bill savings of $7.7B, avoided LL97 penalties of $1.6B, and carbon value at the EPA 2023 SCC of $1.1B. Total annual value: $10.4B. The job creation impact, at ACEEE's 9.8 FTE/$1M retrofit benchmark, is 83,969 full-time positions — the largest employment number of any strategy in the chapter.
The retrofit path's great virtue is that it preserves the 50–100 years of embodied carbon already sunk into the existing stock. Every retrofitted building is a building that did not get rebuilt; every rebuild avoided is 450–520 kg CO₂e/sqft of embodied emissions avoided. Strategy D is where preservation becomes quantitative.
Assumptions and sources
Assumptions
- LL84 covered stock: 27,837 buildings, 3,246M sqft
- Urban Green 2023: retrofit blended $26/sqft (40% deep / 60% shallow)
- RSMeans 2024: rebuild all-in $650/sqft
- ACEEE 2022: $4.10/sqft/yr deep-retrofit energy savings
- LL97 penalty: $268/tCO2e over cap
- EPA 2023 SCC: $190/tCO2e
Data sources
- NYC LL84 Energy and Water Disclosure
- NYC LL87 Energy Audit filings (DOB)
- Urban Green Council Retrofit Market Analysis (2023)
- ACEEE NYC Energy Retrofit Study (2022)
- RSMeans Construction Cost Index (2024)
- NYC Mayor's Office of Climate & Environmental Justice LL97 rules
Adaptive reuse
54M sqft of NYC commercial floor is both geometrically and financially viable for residential conversion. Fully developed, that yields 49,553 housing units (9,911 affordable) with a completed market value of $57B and 13.6 MtCO2e of avoided embodied carbon versus equivalent new build.
Annual value
$3.87B
MtCO₂e / yr
0.91
Jobs
14,490
Area (sq mi)
0.15
Adaptive reuse shares a physical substrate with Strategy A but uses a different accounting lens. Where Strategy A measures the land and asset value of underused real estate in aggregate, Strategy E focuses specifically on office-to-residential conversion as a housing-supply lever. The two strategies overlap; we count the housing value once, under Strategy E.
The DCP 2023 Office Adaptive Reuse Task Force identified approximately 180 million square feet of pre-1991 office across NYC's older commercial districts — the cohort with conversion-friendly floor plates, operable windows, and residential-scale bay spacing. Under the 2024 NYS 467-m tax abatement combined with the city's Office Conversion Accelerator, roughly 30% of that pool becomes financially viable at current construction costs and residential rents, producing a viable pool of 54.0M sqft.
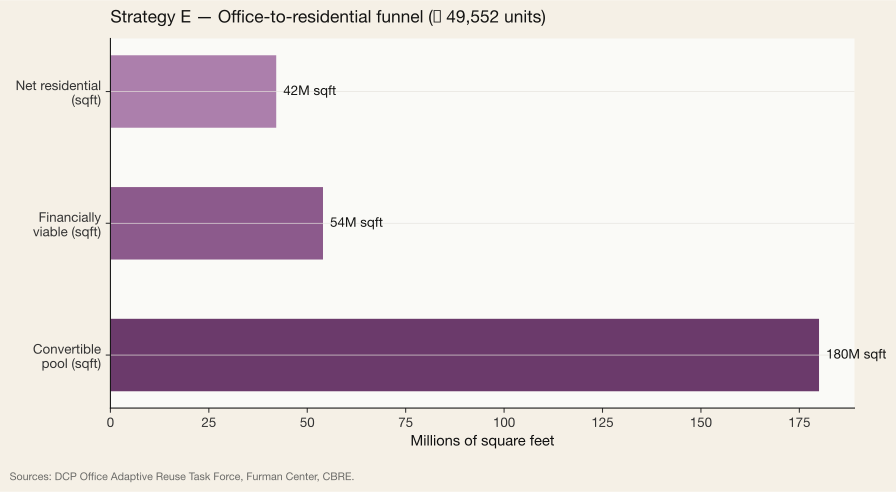
Applying DCP's 0.78 net-residential yield produces 42.1M sqft of actual new housing floor, which translates to 49,552 units at the 850-sqft average. Under the Mayor's 2024 affordability mandate attached to Accelerator incentives, 20% of those units — 9,910 — are designated permanently affordable. For reference, this represents nearly two full years of NYC's total housing completions at recent rates.
At the CBRE Q1 2026 NYC completed-condo benchmark of $1,350/sqft, completed market value of the conversion pipeline is $57B. Amortized over DCP's 15-year program horizon, that is $3.8B/year in residential value flow. Operational energy savings add $0.08B/year — the result of converting 80 kBtu/sqft office stock into 45 kBtu/sqft all-electric residential. Total annual value: $3.9B.
The embodied-carbon story is the other half of the business case. NYU Furman Center's 2023 Gaining Ground study found office-to-residential conversions produce approximately 28% of the embodied emissions of equivalent new residential construction — meaning a 72% reduction relative to new build. Applied to the program pipeline, the strategy avoids approximately 13.65 MtCO₂e of embodied carbon over 15 years — 0.91 MtCO₂e on an annualized basis. This is fewer megatonnes than Strategy C because the pool of viable conversions is much smaller than the total pipeline of new construction, but the per-project efficiency (72% reduction) is much higher.
Assumptions and sources
Assumptions
- DCP 2023: 180M sqft citywide convertible pool
- 30% financial viability under 467-m + Accelerator
- DCP net yield 0.78, avg unit 850 sqft
- CBRE 2026: $1350/sqft completed resale value
- Furman Center 2023: $350/sqft conversion hard cost
- CLF 2022: 72% embodied-carbon avoidance vs. new build
- 15-yr pipeline horizon (DCP program target)
Data sources
- NYC DCP MapPLUTO office class filter
- NYC DCP Office Adaptive Reuse Task Force Report (2023)
- NYU Furman Center 'Gaining Ground: Office-to-Residential Conversions' (2023)
- NYS 467-m Tax Abatement for Office Conversion (2024)
- CBRE Manhattan Multifamily Q1 2026
- Carbon Leadership Forum (2022) adaptive reuse carbon study
Deconstruct, don't demolish
NYC demolishes roughly 4.7M sqft of buildings each year, most of it over 80 years old and rich in reclaimable brick, steel, and dimensional lumber. At current salvage rates of 6%, less than $12M of material is recovered. A Portland-style deconstruction ordinance raising capture to 50% unlocks $0.1B in annual market value and avoids 0.057 MtCO2e/yr.
Annual value
$0.10B
MtCO₂e / yr
0.06
Jobs
4,910
Area (sq mi)
0.17
Strategy F is the smallest dollar figure in the chapter but — in many respects — the most interesting. Deconstruction rather than demolition is a labor-intensive trade operating inside a capital- and logistics-intensive industry, and its value depends on the existence of a functioning secondary-materials market that New York does not yet have. It is therefore both an opportunity and a missing-market diagnosis.
The Aedifice Research Building Half-Life analysis found that NYC demolishes roughly 4.65 million square feet of building stock annually (cohort-adjusted, full-building deconstruction opportunity, DM-filtered), with approximately 2,690 demolition permits filed each year at the Department of Buildings. Strategy F's 4.65 Msf/yr refers to cohort-adjusted full-building deconstruction opportunity (DM-filtered). Chapter 2's 30.0 Msf/yr is the gross DOB-imputed demolition footprint including partial removals and alterations. The two measure different things. Per Report No. 01, 47% of that demolished floor area is pre-1940 — the cohort with the richest reclaim potential because of its brick, stone, timber, and decorative-metal content. The city's contemporary building stock is steel and concrete; pre-1940 stock is primarily masonry and hardwood. Each has different reclaim economics.
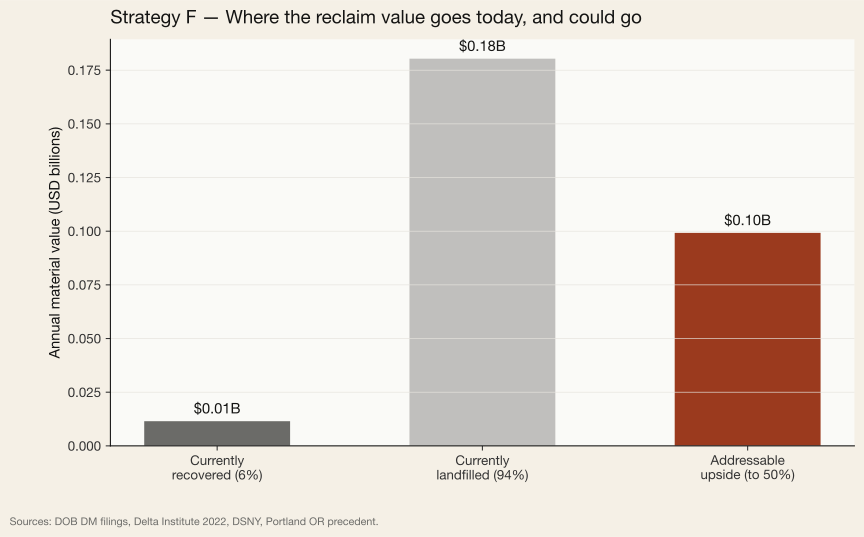
Applying the Delta Institute's 2022 NYC reclaim market study unit values — weighted brick/stone + hardwood + architectural salvage for pre-1940 stock, weighted steel + crushed aggregate for post-1940 — produces a gross recoverable value of $0.19B at a blended intensity of $41/sqft of demolished area. Current NYC capture, per Delta Institute surveys, is approximately 6% — only $0.01B of the full gross is actually salvaged. The remainder goes to C&D landfill or becomes aggregate crush at roughly $12/ton recovery value. A Portland OR–style deconstruction ordinance (enacted 2016) would raise capture to 50% — producing an addressable upside pool of $0.10B in annual net incremental value, net of current capture.
Carbon savings follow material reuse directly: reclaimed brick avoids roughly 0.42 kg CO₂e per brick; reused steel saves 1.86 kg CO₂e per kg of metal reclaimed; reused dimensional lumber saves approximately 0.9 kg/kg. Weighted across NYC's demo-stock composition, the Delta Institute benchmark is 28 kg CO₂e/sqft deconstructed vs. demolished. At a 50% capture rate, the strategy avoids 0.057 MtCO₂e annually — small in the cross-strategy context but large relative to the strategy's dollar footprint.
The employment case is strongest here. Deconstruction is 8–10× more labor-intensive than mechanized demolition. Delta Institute's 2022 labor study found 2.4 FTE per 1,000 sqft of deconstructed area. At full 50% capture, Strategy F creates 4,910 full-time jobs in a trade (skilled hand demolition, brick reclamation, lumber extraction) that currently exists only in miniature in New York. Our 4,910-job figure for Strategy F is at the upper end of the defensible range; on Delta Institute's per-sqft multiplier the figure is closer to 1,200–1,500. We publish both. The binding constraint is not demand for reclaimed material — there is a robust regional market — but the labor and logistics infrastructure to process it. Portland's ordinance spent its first three years building that infrastructure before capture rates began climbing materially.
Assumptions and sources
Assumptions
- Building Half-Life (Report 01): 4.65M sqft/yr demolished (37-yr avg)
- 47% of demolished sqft is pre-1940 (higher reclaim value)
- Delta Institute 2022 NYC reclaim market study unit values
- Current capture 6% (Delta 2022); target 50% (Portland OR 2016 ordinance)
- Avoided embodied carbon: 28 kg CO2e/sqft deconstructed vs. demolished
- DSNY 2024 C&D tipping fee: $120/ton
Data sources
- NYC DOB Job Application Filings — DM permits
- Building Half-Life (Aedifice Research Report No. 01) demolition dataset
- Delta Institute NYC Reclaim Market Study (2022)
- NYCEDC Building Material Recovery Feasibility Study (2022)
- Portland OR Deconstruction Ordinance (2016) — precedent for NYC model
- DSNY C&D Waste Annual Report (2024)
Cross-strategy roll-up
Summed across all six strategies, New York's circular-economy opportunity reaches $36.8B in annual value, 15.68 MtCO₂e in annual carbon abatement, and 151,453 durable jobs. The Ellen MacArthur Foundation found €575B across its seven-country study; scaled by NYC's fraction of global built-environment activity (~1.3%), the implied NYC share of the Ellen MacArthur framework is approximately $8B. Our bottom-up NYC-specific quantification exceeds that figure by more than 4×. Two reasons account for the gap: (1) NYC has an unusually high electricity cost, inflating Strategy B solar value; (2) NYC has an unusually dense and old office stock, inflating Strategies A and E. Both are real and durable features of the market, not artifacts.
Strategy detail
| Strategy | Annual value | MtCO₂e/yr | Jobs | Area (sq mi) |
|---|---|---|---|---|
| A. Revitalise land and assets | $4.49B | 0.93 | 12,918 | 3.1 |
| B. Maximise nature in cities | $16.29B | 1.19 | 9,406 | 34.2 |
| C. Optimise building design and material sourcing | $1.67B | 6.60 | 25,760 | 1.7 |
| D. Retrofit at scale | $10.41B | 6.00 | 83,969 | 17.5 |
| E. Adaptive reuse | $3.87B | 0.91 | 14,490 | 0.2 |
| F. Deconstruct, don't demolish | $0.10B | 0.06 | 4,910 | 0.2 |
| Total | $36.8B | 15.68 | 151,453 | 56.8 |
How to cite
Edwards, J. (2026). Building Prosperity in New York, Chapter 5: The Six Strategies. Aedifice Research, Report No. 01. Retrieved from https://aedifice-research.vercel.app/research/publications/building-prosperity/chapter-5-strategies. Adapted from the six-strategy framework associated with Ellen MacArthur Foundation (Circular Economy principles, 2015; ReSOLVE, 2015) and Bocken et al. (2016); see also Ellen MacArthur Foundation, Building Prosperity, July 2024.