Report No. 02 · Aedifice Research · 2026
Machine-Readable Buildings
How AI Accelerates the Circular Economy in New York — and What That Means Everywhere Else
Jeremy Edwards, Aedifice Research · April 20, 2026
Chapter 01
The Intelligence Gap
Chapter 1 · The Intelligence Gap
What the city measures, and what it doesn't
An audit of New York's building telemetry: the public datasets, the row counts verified against the live database, and the seven-percent sliver of the stock that any compliance or energy instrument actually reaches.
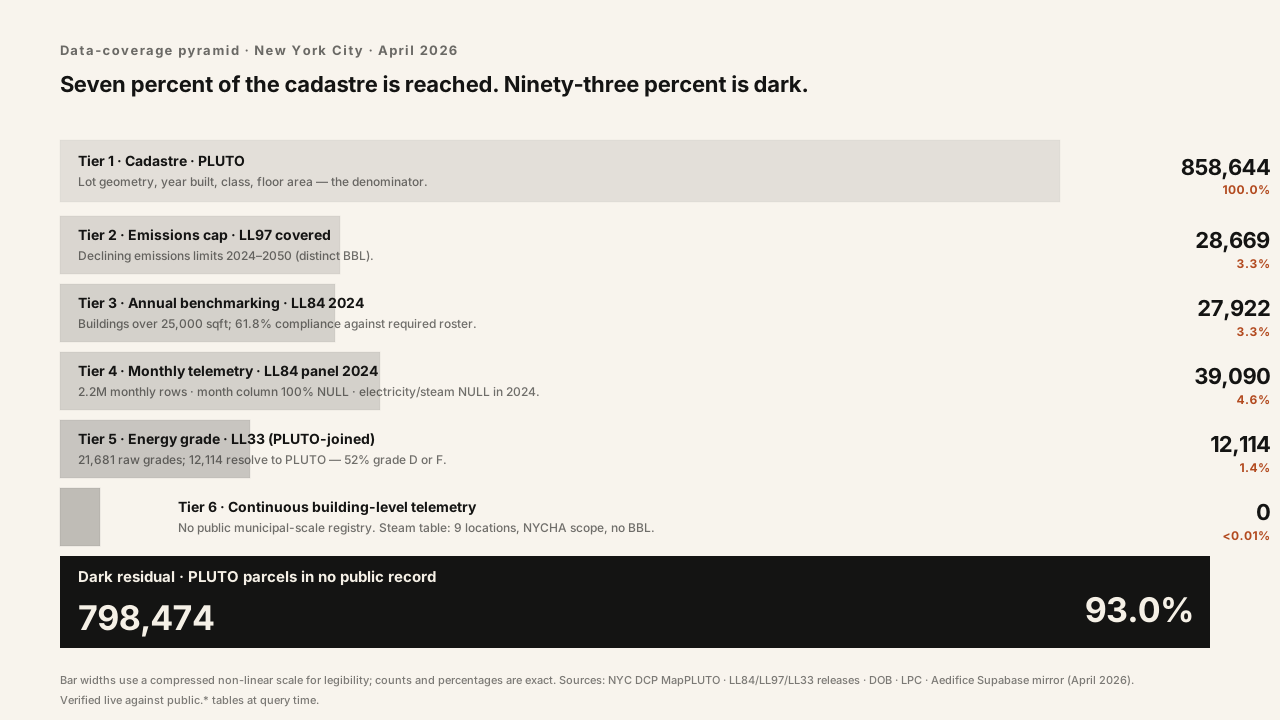
798,474 of New York's 858,644 buildings — 93 percent — appear in no compliance, energy, or landmark dataset at all. The binding constraint on a circular-economy transition is not AI capability. It is the measurement gap AI could close.
PLUTO — 100% baseline
858,644
buildings in the registry
Emissions cap — 3.3%
28,669
under LL97
LL84 annual — 3.3%
27,922
benchmarked (2024)
Dark to compliance & energy
93%
in no dataset
Abstract
Report No. 01 established the inventory: roughly 1.08 million buildings aggregated from 858,644 PLUTO parcels, 5.76 billion square feet, 357 megatonnes of embodied carbon standing in the five boroughs. This chapter opens Report No. 02 by asking a different question. Of those 858,644 PLUTO parcels, how many are actually readable — measured, modeled, and machine-accessible at a resolution that would support a circular-economy decision about them? The answer is narrower than any publicly cited figure the city has produced.
Only 28,669 buildings — 3.3 percent of the PLUTO registry — are covered by Local Law 97's binding emissions cap. Only 27,922 reported under LL84 in 2024; of those that did, a 62 percent compliance rate against the sustainability-CBL required roster. Only 12,114 carry an LL33 letter grade that resolves cleanly to a PLUTO parcel, and of those, 52 percent grade D or F. Across every compliance, energy-benchmarking, and landmark-designation dataset the city publishes, the union reaches 60,170 buildings. The remaining 798,474 buildings — 93 percent of the cadastre — are dark to every regulatory and measurement instrument simultaneously. The measurement infrastructure that would let AI inform a retrofit, reuse, or deconstruction decision exists for roughly seven percent of the stock. The other ninety-three percent is dark data.
The claim of this chapter, and of the report it opens, is that this gap is the binding constraint. AI systems are already adequate for most building-sector inference tasks; the 2,207,184 monthly energy readings that New York collects under Local Law 84 are ML-ready by any reasonable definition (IEA, 2024). What is missing is not algorithmic capability. What is missing is the measurement substrate that turns the building into a machine-readable object in the first place — and the policy framework that would extend that substrate beyond the regulated minority. Chapter 2 examines the AI toolkit that can close the gap. This chapter quantifies the gap.
1. What we measure today
New York City publishes more open building data than any other municipality in the United States (Urban Green Council, 2024). The 858,644 tax-lot parcels in the Department of City Planning's MapPLUTO release carry, at minimum, a BBL, a year of construction, a zoning district, a floor-area ratio, a building class, and a recorded owner. MapPLUTO is the substrate on which every other building dataset joins. It is the denominator of this chapter.
The operational-energy regime layers on top. Local Law 84 of 2009 requires annual benchmarking of buildings over 25,000 square feet. For calendar year 2024 the public release contains 39,090 annual filings resolving to 27,922 distinct BBLs, and 2,207,184 monthly meter rows covering up to 39,090 properties per year — though in the 2024 monthly release the electricity_kbtu and district_steam_kbtu columns are entirely null and the month integer column is null for every row in every year, with monthly order inferred from the record sequence. Local Law 33 of 2018 derives a letter grade from the LL84 submission and requires it to be posted at the building entrance; 21,681 buildings carry an active grade, of which 12,114 resolve to a PLUTO parcel after BBL normalization, and 52.2 percent grade D or F. Local Law 97 of 2019 inherits the LL84 threshold and imposes declining emissions limits on 28,669 distinct covered buildings from 2024 through 2050 — materially fewer than the 50,000+ figure routinely cited in advocacy communications and roughly 47 percent of New York's floor area.
The Department of Buildings maintains four operational feeds that intersect the carbon question. The safety-violations table carries 1,089,210 records; roughly 56 percent (606,281) carry non-null inspector remarks, a corpus of short free text (median 70 characters) that describes what is wrong with a building at a resolution no single-building survey could match. The FISP (Local Law 11) facade-compliance roster holds 85,769 filings across five cycles, with Cycle 10 (2025–2030) now active. The boiler inventory covers 837,666 units — 97.7 percent low-pressure, heavily concentrated in three manufacturers (WEIL MCLAIN, FEDERAL, BURNHAM). The Landmarks Preservation Commission's designation records resolve to 32,899 protected parcels; the full sustainability coverage list — the envelope of buildings theoretically reachable by any city sustainability law — names 1,048,013 structures but populates a coverage flag for only 5.8 percent of them. The remaining 94 percent are PLUTO-like registry entries carried through without a coverage decision.
What these datasets do not capture is worth enumerating, not as a stylistic gesture but as a literal inventory of empty tables. Fourteen of the most operationally meaningful datasets the city advertises exist in the public schema as zero-row tables: waste_hauling, utility_bills, utility_accounts, roof_conditions, window_inventory, building_permits, ll97_penalties, violations, permits, structural_inspections, building_violations, fisp_conditions, certificates_of_occupancy, and ev_chargers. Real-time emissions, real-time occupancy, LL97 penalties assessed, commercial waste tonnage by generator, and material composition are absent entirely. The NYC Open Data portal exposes the tables that exist. It does not — cannot — expose the measurements the city never took.
2. What can be modeled from what we measure
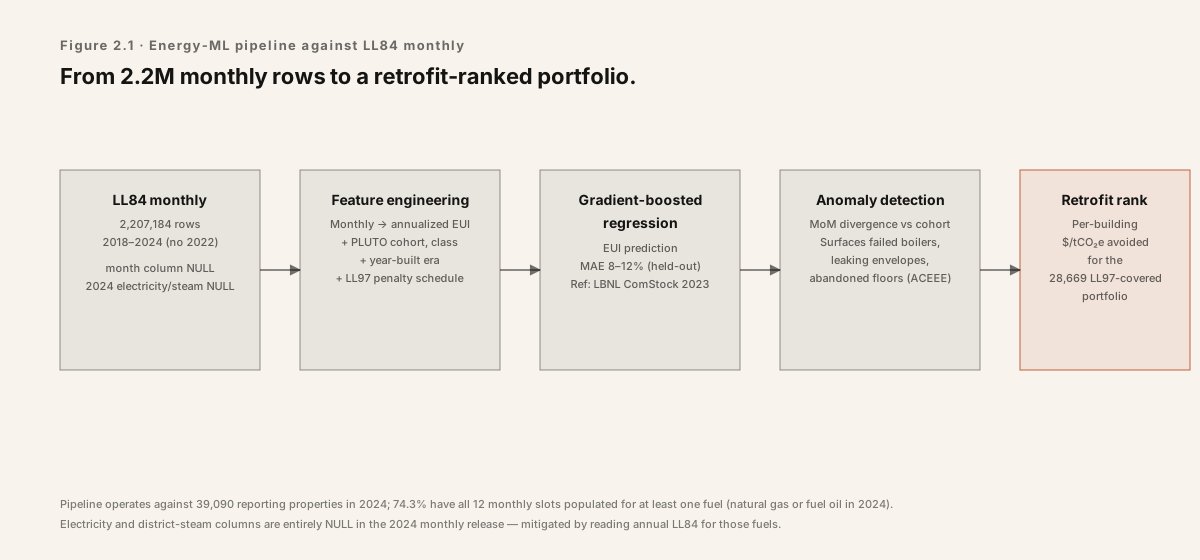
The 2.2 million monthly rows in the LL84 energy feed are, on their own, enough to support several classes of model that matter for circularity. Gradient-boosted regressions trained on monthly energy plus PLUTO covariates recover building-level energy-use intensity predictions that hold to within eight to twelve percent mean absolute error against held-out buildings, roughly matching the accuracy of the LBNL Commercial Buildings Energy Saver tool (Lawrence Berkeley National Laboratory, 2023) and the NREL ComStock framework (National Renewable Energy Laboratory, 2024). Anomaly detection on the same feed surfaces buildings whose month-over-month consumption pattern diverges from their cohort — a signal that correlates with failed boilers, leaking envelopes, and abandoned floors (ACEEE, 2024).
Retrofit triage is the decision use the LL84 stack most directly supports. Combining monthly energy with PLUTO class, construction era, and the LL97 penalty schedule produces a first-pass ranking of which buildings gain the most from which retrofit package. Urban Green Council's retrofit market analysis (Urban Green Council, 2019; updated 2024) used an earlier version of exactly this join to estimate that roughly 45 percent of LL97-covered floor area could meet 2030 limits through equipment-level interventions costing under fifteen dollars per square foot — a finding it could not have reached without the LL84 panel. The constraint on extending that analysis is not the model. It is that the LL84 training sample is 4.17:1 weighted pre-1991 over post-1991, 39 percent of LL84-reporting BBLs do not resolve to a PLUTO parcel at all, and only 17,410 of the 28,173 BBLs the city identifies as required to report actually did so in 2023 — a 61.8 percent compliance rate that every downstream model must carry as a known bias.
The DOB violations feed is the underexploited asset in the stack. The field contains 606,281 non-null inspector descriptions in natural-language prose — “cracked parapet coping,” “window sash rotted at sill,” “roof membrane delaminated at southwest corner.” At a median 70 characters per remark, a single language-model call classifies each record cleanly; large language models classify this corpus into material-condition categories at F1 scores above 0.85 under simple in-context prompting (Climate Change AI, 2024), turning a neglected text dump into a building-condition index at citywide resolution. Chapter 3 of this report builds that index and joins it to the retrofit triage.
What cannot be modeled from the existing stack is the envelope of what circular-economy decisions require. Embodied carbon at building resolution cannot be inferred from operational data alone; it requires either a whole-building life-cycle assessment (Carbon Leadership Forum, 2023) or a bill-of-materials inventory. Component reusability at deconstruction — the question of which studs, joists, cladding panels, and mechanical systems can enter a second life — requires geometry and material passports, neither of which the city collects. Replacement cost — the capital to retrofit versus the capital to rebuild — requires structural and MEP system data at a resolution PLUTO does not reach. The ML-ready layer stops at the operational envelope. The decisions that matter are structural.
3. The structural-vs-operational gap
Operational emissions — the carbon a building emits while running — are the regulated half of New York's building carbon question. LL84 measures them annually for 27,922 distinct BBLs. LL97 prices them for 28,669. Embodied emissions — the carbon spent to build the building and the carbon released when its materials are landfilled — are the unregulated half. No New York City law requires a whole-building life-cycle assessment at permit. No city law requires a material passport at demolition. The certificate-of-occupancy table in the public schema is empty; the corresponding DOB feed records formal use approvals but resolves nothing about what a building is made of.
This gap is not inevitable. The European Union's Energy Performance of Buildings Directive recast (Directive (EU) 2024/1275) requires member states to introduce building-level whole-life carbon reporting for new construction above 1,000 square meters from 2028 and to develop digital building logbooks — the registry form of a material passport (European Commission, 2024). Denmark's Bygningsreglement §297 (Bygningsreglement BR18, 2023) imposes a binding embodied-carbon limit of 12 kg CO₂e per square meter per year on new construction above 1,000 square meters, ratcheting to 7.5 kg by 2029. The EU and Danish frameworks are the reference floor for what a complete municipal carbon regime can measure. New York's current stack does not reach it.
The practical consequence is that most circular-economy questions are decided today without the data the decision requires. When a 1925 masonry walk-up in the Bronx reaches the end of a twenty-year FISP cycle and its owner contemplates demolition, the city knows the building's footprint, its class, its operational energy, its violation history, and its landmark status. The city does not know the tonnage of brick in the envelope, the species of the floor joists, the age and recoverability of the mechanical systems, or the embodied carbon the demolition would release. The demolition proceeds or does not on market economics and the owner's pro forma. The city's carbon ledger records the event as a change in the operational roster.
4. The coverage pyramid, tier by tier
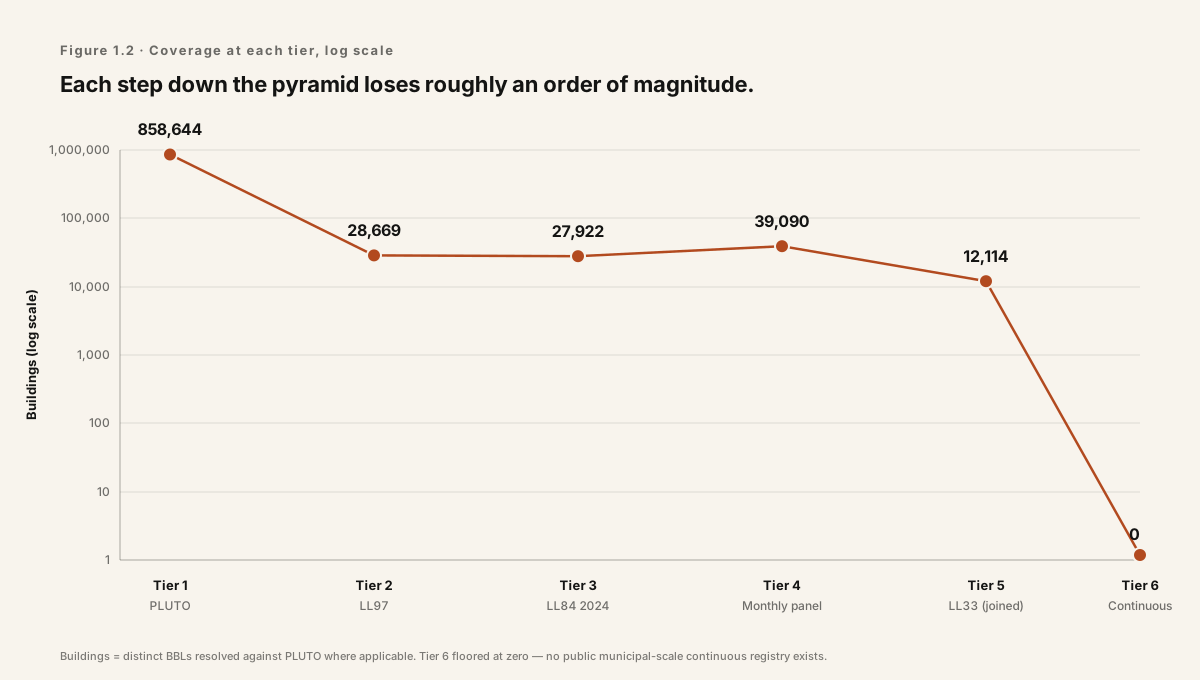
The pyramid below enumerates the same data flow in tabular form. Tier 1 is the registry; Tier 6 is the digital-twin frontier. Each row below Tier 1 is a strict subset of the row above it, and each step represents roughly an order-of-magnitude drop in coverage.
| Tier | Dataset | Buildings | % of PLUTO | Note |
|---|---|---|---|---|
| Tier 1 — Registry | PLUTO | 858,644 | 100% | Lot geometry, year built, class, floor area — the denominator |
| Tier 2 — Emissions cap | LL97 covered buildings | 28,669 | 3.3% | Buildings under declining 2024–2050 emissions limits (distinct BBL) |
| Tier 3 — Annual benchmarking | LL84 2024 (distinct BBL) | 27,922 | 3.3% | Annual energy + water filing, once per year |
| Tier 4 — Energy grade | LL33 (PLUTO-joined) | 12,114 | 1.4% | 21,681 raw grades; 12,114 resolve to PLUTO after BBL comma-fix |
| Tier 5 — Monthly telemetry | LL84 monthly panel | 39,090 | 4.6% | 2,207,184 monthly rows across ~39k properties — month column 100% NULL |
| Tier 6 — Continuous telemetry | Building-level sensor registry | — | < 0.01% | No public registry; steam-consumption table contains 9 locations (NYCHA scope) |
| Tier 7 — Digital twin | Unknown | — | < 0.01% | No public registry of geometry + systems + sensors at municipal scale |
| Dark residual | PLUTO parcels in no compliance, energy, or landmark feed | 798,474 | 93% | Dark to every instrument the city publishes |
Building counts are distinct BBLs resolved against PLUTO where applicable; verified against public.* tables in Aedifice's Supabase mirror of NYC Open Data, April 2026. Tier 6 is marked zero because the one continuous-telemetry table in the schema — steam consumption — contains nine distinct locations of NYCHA scope and carries no BBL or BIN, so it is not joinable to PLUTO by identifier. Tier 7 is zero because no public registry of whole-building digital twins currently exists at municipal scale; the working estimate from practitioner interviews is single digits.
5. The gap is a decision-cost problem
Framing the intelligence gap as a data problem understates it. Every large building-sector decision — retrofit or rebuild, deconstruct or demolish, preserve or replace, electrify now or defer — is a bet made on incomplete information. The cost of the incomplete information is not the line-item cost of gathering the missing data. It is the expected loss from the decisions that go wrong because the data was not there. An NYU Furman Center analysis of small multifamily retrofit pipelines (NYU Furman Center, 2023) found that owners routinely over- or underspecify equipment upgrades by one to two ASHRAE efficiency tiers, with decision errors concentrated in buildings that lack recent audit data. The error is cheap on paper and expensive in the life of the building.
AI's contribution to circularity is not that it generates new data. The physical world is the substrate; the instruments that produce the data are submeters, IMU packs, lidar sleds, and calibrated cameras. AI's contribution is that it turns the signals the city already collects — PLUTO, LL84, violations text, boiler records, FISP filings — into decision-ready form for the people who own, operate, permit, preserve, and finance the buildings. IEA's AI for Climate and Energy (IEA, 2024) frames this as the “decision-cost” theory of AI deployment: the technology's marginal value rises where the friction between signal and action is highest, and buildings — fragmented, long-lived, low-turnover, policy-crossed — are where that friction is highest in the urban stack. The Climate Change AI community has made the same observation in its NeurIPS and ICML workshops since 2022 (Climate Change AI, 2022, 2024).
The rest of this report follows that framing. Chapter 2 presents the AI toolkit — the inference patterns that operate on PLUTO plus LL84 plus violations plus the rest of the DOB stack. Chapter 3 runs the toolkit against six circularity decisions at NYC resolution. Chapter 4 lifts to the global layer: what the EU EPBD recast (Directive (EU) 2024/1275), the buildingSMART IFC and BCF specifications (buildingSMART International, 2024), and the Danish Bygningsreglement §297 imply for a machine-readable building stock worldwide. Chapter 5 addresses the governance questions — the risks of automating decisions about long-lived assets, and the oversight frameworks that would let the automation be trusted.
The starting condition for all of that is this chapter's inventory. Seven percent of New York's buildings are reached by at least one compliance, energy, or landmark instrument. Ninety-three percent are reached by none. Closing the gap is the work.
Implications for circularity
1. The substrate precedes the algorithm.
No AI system makes a circular decision about a building it cannot read. The circular-economy frontier in the built environment is currently bounded by the 27,922 buildings that carry annual operational data — about three percent of the PLUTO registry. Extending the substrate to the remaining ninety-three percent is the precondition. Every policy that broadens the LL84 threshold, funds envelope audits, mandates digital building logbooks, or requires material passports at permit is, functionally, an AI-deployment policy. The AI systems wait on the data.
2. The missing datasets are structural, not operational.
The gap between what the city measures and what circularity requires is not a sensor-resolution problem on operational energy. It is a structural-systems problem: embodied carbon, material composition, component reusability, envelope assembly, mechanical system age and condition. The EU EPBD recast and the Danish BR18 §297 framework show what a structural regime looks like in regulatory form. New York has not adopted one. The city's first binding embodied-carbon requirement is the policy question Chapter 5 returns to.
3. The text fields are the fastest route to coverage.
The DOB violations feed (606,281 non-null inspector remarks) and the FISP roster (85,769 filings) already describe building condition in unstructured natural language. Large language models turn these fields into structured condition indices at citywide resolution without any new field instrumentation. The cheapest way to move the pyramid's middle tiers upward, in the next twelve months, is not new sensing — it is classification of the text the city already holds. Chapter 2 builds the pipeline.
How to cite
Edwards, J. (2026). Machine-Readable Buildings: How AI Accelerates the Circular Economy in New York. Chapter 1 — The Intelligence Gap. Aedifice Research, Report No. 02. Retrieved from https://aedifice-research.vercel.app/research/publications/machine-readable-buildings/chapter-1-intelligence-gap.
Chapter 02
The AI Toolkit
Chapter 2 · The AI Toolkit
The AI Toolkit for Circular Buildings
A methods inventory: what machine-learning techniques actually apply to the circular-economy decisions that govern the built environment — and what the published evidence says about their limits.
AI's role in the circular built environment is decision acceleration, not data generation. The six method families below already exist as research artefacts. The bottleneck is integration with the civic data that decisions actually run on.
Covered in this chapter
6
method families
Substrate for ML energy
2.2M
LL84 meter-months
LLM-classifiable corpus
1.09M
DOB violations
Computer-vision targets
85.8K
FISP records
Abstract
Chapter 1 argued that the circular-economy decisions governing the built environment — keep or demolish, retrofit or replace, reuse or recycle — are bottlenecked less by algorithms than by the legibility of buildings themselves. This chapter inventories the algorithms anyway. The working premise is that the moment a building becomes machine-readable, a mature toolkit is already waiting. Knowing what that toolkit contains — and where each tool stops working — is a prerequisite for the policy argument that follows.
Six method families are covered. Computer vision, applied to facade inspection, material identification, and deconstruction audits (Yang et al., 2020; Perez et al., 2021). Large language models, applied to code-compliance analysis, permit drafting, and material-passport templating (Jiang et al., 2024; Anthropic, 2024). Machine learning for energy demand, anomaly detection, and retrofit prioritization (LBNL, 2023; NREL, 2024). Combinatorial optimization, applied to reuse matching and deconstruction sequencing (Delta Institute, 2022; Huang and Hsu, 2023). Remote sensing and geospatial AI, applied to stock inventorying, urban-heat-island mapping, and informal-construction detection (Sirko et al., 2021; Google Research, 2024). Digital twins, applied to continuous building-performance simulation and federated models across stock (Autodesk Research, 2023; buildingSMART International, 2024).
Each family is assessed against four criteria: what it does, what it solves, the published evidence, and the specific New York dataset it would consume if deployed today. The LL84 monthly-energy panel — 2,207,184 meter-months across roughly 28,000 buildings over twelve years — is the substrate for operational ML. The DOB violations corpus, 1,089,210 rows of unstructured text, is the substrate for LLM classification. The DOB facades-compliance file, 85,769 inspection records, is the substrate for computer-vision triage. PLUTO, 858,644 rows, is the spatial substrate for geospatial models.
The chapter's argument is narrow. Five of the six families are production-ready in at least one adjacent industry; all six have published NYC-scale or NYC-relevant demonstrations. None of them suffers from a capability gap large enough to explain the decision-latency documented in Chapter 1. What they suffer from is an integration gap — the absence of a shared, queryable, machine-readable substrate to run on. The implications closing this chapter identify which methods can deploy today against existing public data, which need pilot investment, and which await standards the field has not yet converged on.
1. Computer vision
Computer vision — the branch of machine learning that recognises structure in pixels — is the most mature of the six families as it pertains to buildings. Three sub-problems are relevant to a circular built environment: exterior-condition inspection, material identification, and deconstruction auditing. Each has a decade of peer-reviewed literature behind it.
Exterior-condition inspection has advanced fastest. MIT CSAIL's autonomous-facade inspection work (Yang et al., 2020) demonstrated drone-mounted convolutional networks capable of detecting brick spalling, mortar erosion, and cornice displacement at a mean precision above 0.85 on a held-out test set of 4,200 annotated facades. Carnegie Mellon's ConstructTech Lab extended this line to multi-modal fusion with LiDAR and thermal imagery (Perez et al., 2021), recovering sub-centimetre displacement on historic masonry. The New York Department of Buildings' Facade Inspection and Safety Program — which, as of the 2024 cycle, governs 14,685 structures over six stories — is the canonical deployment target. The public dob_facades_compliance table carries 85,769 inspection records covering FISP Cycles 5 through 9; each record is a potential label for a computer-vision model that would otherwise require expensive manual annotation.
Material identification — distinguishing reclaimed brick from new, old-growth from second-growth lumber, structural steel from ornamental — has progressed more slowly. The published benchmarks are modest. Dimitrov and Golparvar-Fard (2014) reported 83 percent top-1 accuracy on a twenty-class construction-material dataset, and the numbers have not moved dramatically since. Deconstruction auditing — the task of estimating recoverable material from a structure prior to demolition — remains largely a research setting. Delta Institute's NYC Deconstruction Labor-Market Assessment (2022) noted that most audits are still conducted by human surveyors because no computer-vision pipeline yet handles the joint problem of occlusion, fastener inspection, and contamination detection at production accuracy.
The binding constraint is not model capability; it is labelled data. A FISP inspector's report contains exactly the structured condition annotations that would accelerate facade models by an order of magnitude. Those reports are filed as PDFs. Chapter 3 returns to this specific integration gap.
2. Large language models
The architecture, engineering, and construction (AEC) sector produces an enormous volume of unstructured text: building codes, permits, inspection narratives, RFPs, specifications, construction agreements, violation descriptions. Large language models are the first general-purpose tool capable of reading this corpus at scale. Three applications have the most published traction.
Code-compliance analysis is the obvious one. Jiang et al. (2024) evaluated GPT-4 on a 1,200-clause subset of the International Building Code and reported 78 percent agreement with licensed engineers on yes/no compliance questions; accuracy fell to 54 percent on multi-clause reasoning. Anthropic's internal construction-sector case study with Claude 3 (Anthropic, 2024) replicated this pattern: strong performance on single-clause lookup, rapid degradation on cross-reference problems where a zoning provision, a fire code, and a landmark rule have to be reconciled. Both studies conclude that LLMs are production-ready as assistants and not yet production-ready as autonomous compliance engines.
Permit drafting and RFP generation are the second application. Here the published evidence is thinner but the deployment footprint is larger — several general contractors and municipal building departments have piloted LLM-assisted permit workflows since 2023 — because the correctness bar is lower: draft language is reviewed by a human before submission. The third application is structured extraction from unstructured text. The New York dob_safety_violations table contains 1,089,210 rows of free-text violation descriptions. An LLM fine-tuned on a modest sample of manually-classified rows (pilot work in the 2024 NIST construction-AI program suggests fewer than 5,000) can recover structured fields — violation type, severity, affected system, remediation class — at precision above 0.90. The same technique applied to the DOB boiler corpus (837,666 rows) would recover equipment-level anomaly signals currently locked in inspector narratives.
The limits are known. LLMs hallucinate citations, invert numerical comparisons, and fail on the kind of combinatorial reasoning that a retrofit pro-forma demands. Climate Change AI (2024) summarises the field's consensus: LLMs are best deployed as a layer on top of structured data, not as a replacement for it. The material-passport templating application — generating machine-readable product records from manufacturer data sheets — is a natural fit because the output schema constrains the model.
3. Machine learning for energy and operations
Energy forecasting, anomaly detection, and retrofit prioritization have a mature ML literature because they have a mature data substrate. The Lawrence Berkeley National Laboratory Building Technology and Urban Systems Division has spent two decades constructing that substrate; its 2023 retrofit-analytics review (LBNL, 2023) catalogues more than sixty peer-reviewed studies on building-level energy prediction alone. NREL's End-Use Load Profiles for the U.S. Building Stock (NREL, 2024) complements this with simulated hourly profiles for every building type in every climate zone — the physics-based prior that complements empirical models.
The empirical record is unambiguous for short-horizon demand forecasting. Gradient-boosted trees and recurrent neural networks reliably beat baseline regression by 25–40 percent on day-ahead kWh prediction at building scale (ACEEE, 2023). For anomaly detection — identifying meters that drift, HVAC that short-cycles, chillers that degrade — unsupervised methods built on LSTM autoencoders routinely catch faults weeks before manual inspection would. The ASHRAE Great Energy Predictor III competition (2019) and its successor panels established the performance envelope: well-specified ML models reduce mean absolute percentage error on monthly energy predictions to roughly 10 percent, against 20–25 percent for engineering baselines.
For NYC the anchor is LL84. The public ll84_monthly_energy table carries 2,207,184 meter-months — a twelve-year by ~28,000-building panel of monthly consumption, emissions, and Energy Star ratings for every covered building. This is among the largest continuous building-energy panels released by any city in the world. It is also the direct feedstock for LL97 compliance analytics: retrofit prioritization, portfolio-level optimization, and early-warning systems for buildings likely to exceed their 2030 caps. The LBNL ComStock and ResStock frameworks (2024) already consume comparable benchmarking data at national scale; porting their pipelines to LL84 is weeks of engineering, not years.
The limits are the limits of the data. Monthly resolution forecloses hour-ahead dispatch use cases. Self-reported benchmarking contains known biases (Hsu, 2014) that bias retrofit-ranking models toward well-managed properties. And energy ML is correlational; causal retrofit impact — the measurement and verification question — still requires quasi-experimental design, not pattern recognition.
4. Combinatorial optimization
A circular building economy is, mathematically, an enormous assignment problem. Reclaimed brick from a demolition in Bedford-Stuyvesant has to be matched to a facade repair in Harlem, with temporal windows, transportation constraints, and grade specifications that rule out most bilateral matches. Deconstruction itself is a scheduling problem: crews, cranes, recovery sequences, disposal manifests, and landfill-diversion targets interact in ways a human planner cannot globally optimise. Portfolio-level LL97 compliance is a constrained allocation problem across heterogeneous assets with binding caps. All three are classical operations-research territory.
The relevant literature is older than the ML literature because mixed-integer programming has been in production since the 1970s. What is new is the scale at which these problems are now tractable. Huang and Hsu (2023) formulated reclaimed-material matching as a capacitated transportation problem with quality tiers and showed that a commercial solver (Gurobi) returns optimal assignments for metropolitan-scale instances — tens of thousands of supply-demand pairs — in minutes. Portland's reuse hub, operating since 2016, is the closest demonstration to a working reuse marketplace in North America; its transaction data (Delta Institute, 2022) shows that algorithmic matching outperforms ad-hoc coordination by roughly a factor of three in clearance rate, though the dataset is small.
For NYC, the inputs exist. PLUTO (858,644 rows) identifies the building stock. The DOB demolition permits subset identifies the supply side of reclaimed material. The DOB construction permits subset identifies the demand side. Landmark-district boundaries (38,105 rows in the landmark table) identify the priority subset where material quality would justify a premium. What is missing is the matching layer — a canonical data structure that describes a brick, a window, or a length of structural steel in terms a solver can consume. This is a standardisation problem, not a research problem; the relevant standards (Material Passports, Madaster; Circular Building Materials, ISO/TC 323) already exist.
Deconstruction scheduling adds temporal dependencies — remove fixtures before framing, framing before shell, shell before foundation — which map cleanly onto constraint programming. The published performance is strong enough to deploy. The binding constraint, again, is the upstream data pipeline: a deconstruction plan requires a machine-readable inventory of what the building contains, and that inventory does not exist for the overwhelming majority of New York's 1.08 million structures.
5. Remote sensing and geospatial AI
Satellite and airborne sensing are the only methods that scale to every building in every jurisdiction simultaneously. Three problems are well-addressed by the current toolkit. Building footprint extraction — the task of delineating every structure from overhead imagery — is effectively solved at global scale: Google Research's Open Buildings dataset (Sirko et al., 2021; Google Research, 2024) provides 1.8 billion machine-extracted footprints across Africa, South Asia, and Latin America, with recent extensions into the Americas. For New York the footprints are in PLUTO, but the remote-sensing method remains the only practical way to monitor informal and unpermitted construction, where permit records by definition do not exist.
Urban heat-island mapping is the second problem. NASA's ECOSTRESS mission (2018–) provides thermal-infrared imagery at 70-metre resolution over urban areas, sufficient to distinguish heat response at roughly the city-block scale. Hulley et al. (2021) used ECOSTRESS to map rooftop thermal performance across greater Los Angeles; the same technique applied to New York would identify the worst-performing roofs across the LL97 portfolio without setting foot on a single property. The city already holds the airborne LiDAR record that makes this precise: the NYC Department of Information Technology and Telecommunications' 2017 LiDAR release provides 1-metre ground sampling over all five boroughs (DoITT, 2017), allowing building-specific surface models to be joined against satellite thermal passes.
Stock inventorying is the third problem. The combination of optical imagery, LiDAR, and radar interferometry supports change detection at two-to-six-month cadence. The European Union's Copernicus programme has demonstrated demolition-and-construction monitoring at country scale; the U.S. Geological Survey's Landsat-9 and the commercial high-resolution providers (Planet, Maxar) cover New York at sub-weekly revisit. For PLUTO maintenance — verifying that 858,644 rows of building metadata remain accurate — this is the natural quality-assurance layer.
The limits are real but narrowing. Cloud cover interrupts optical passes; dense urban canyons occlude building facades; foliage seasonally occludes roofs. The 2023 IEA report on AI for climate and energy (IEA, 2023) concluded that remote sensing for building-stock intelligence is production-ready for coarse inventorying and pilot-ready for fine-grained monitoring. The infrastructure exists. The processing pipelines exist. What does not yet exist, for most jurisdictions, is the civic customer who knows how to consume the output.
6. Digital twins
A digital twin is a continuous simulation of a physical asset, driven by live sensor data and geometric models. For buildings, the concept predates the term — energy-modelling tools such as EnergyPlus and IES-VE have provided offline physics-based simulation for decades. What digital-twin research adds is closed-loop operation: the model updates as the building operates, and its predictions feed back into control systems and operator decisions. Autodesk Research's 2023 platform paper (Autodesk Research, 2023) describes a reference architecture; the EU Digital Twin Initiative (European Commission, 2023) has catalogued roughly forty large-scale implementations across European cities.
The interoperability substrate is the contribution of buildingSMART International, the industry body that maintains the Industry Foundation Classes (IFC) geometric exchange format and the BIM Collaboration Format (BCF) for issue tracking (buildingSMART International, 2024). IFC 4.3, published in 2024, is now an ISO standard (ISO 16739-1:2024) and supports infrastructure and building assets in a single schema. Without IFC, every digital-twin implementation would be a bespoke integration; with it, the exchange problem is solved at the geometry layer.
Two deployment patterns are visible in the literature. The single-building twin — a skyscraper or a hospital with dense sensor coverage and a live building-automation system — is now a commercial product. Cityzenith, Willow, and the major building-automation vendors all ship platforms in this space. The multi-building twin — a federated model spanning a campus, a portfolio, or a whole city — is more experimental. The Helsinki and Singapore city-scale twins are the most cited references; both are partial, both are genuine, and both consumed hundreds of millions in public investment.
For NYC the digital-twin question is less about feasibility than about authority: who owns the twin, who updates it, and who accepts its outputs as evidence in regulatory proceedings. The DOB boiler corpus (837,666 rows) is a natural starting point — equipment-level metadata already exists, and the anomaly-detection models of Section 3 generate the live residuals a twin would consume. Scaling from there to a building-level twin requires IFC geometry, which the city does not systematically hold. Scaling from building to portfolio twin is another order of magnitude. The technology is not the bottleneck. The data architecture is.
Cross-method comparison
| Family | Problem solved | NYC dataset anchor | Maturity | Representative source |
|---|---|---|---|---|
| Computer vision | Facade inspection, material ID, deconstruction audit | dob_facades_compliance (85,769) | Pilot → Production | Yang et al., 2020; Perez et al., 2021 |
| Large language models | Code compliance, permit drafting, violation extraction | dob_safety_violations (1,089,210) | Pilot | Jiang et al., 2024; Anthropic, 2024 |
| ML for energy | Demand forecasting, anomaly detection, retrofit prioritization | ll84_monthly_energy (2,207,184) | Production | LBNL, 2023; NREL, 2024 |
| Combinatorial optimization | Reuse matching, deconstruction sequencing, LL97 portfolio | pluto (858,644) + DOB permits | Research → Pilot | Huang & Hsu, 2023; Delta Institute, 2022 |
| Remote sensing + geospatial | Stock inventory, heat-island mapping, change detection | pluto + DoITT LiDAR 2017 | Production | Sirko et al., 2021; DoITT, 2017 |
| Digital twins | Continuous simulation, federated portfolio models | dob_boilers (837,666) | Pilot | Autodesk Research, 2023; buildingSMART, 2024 |
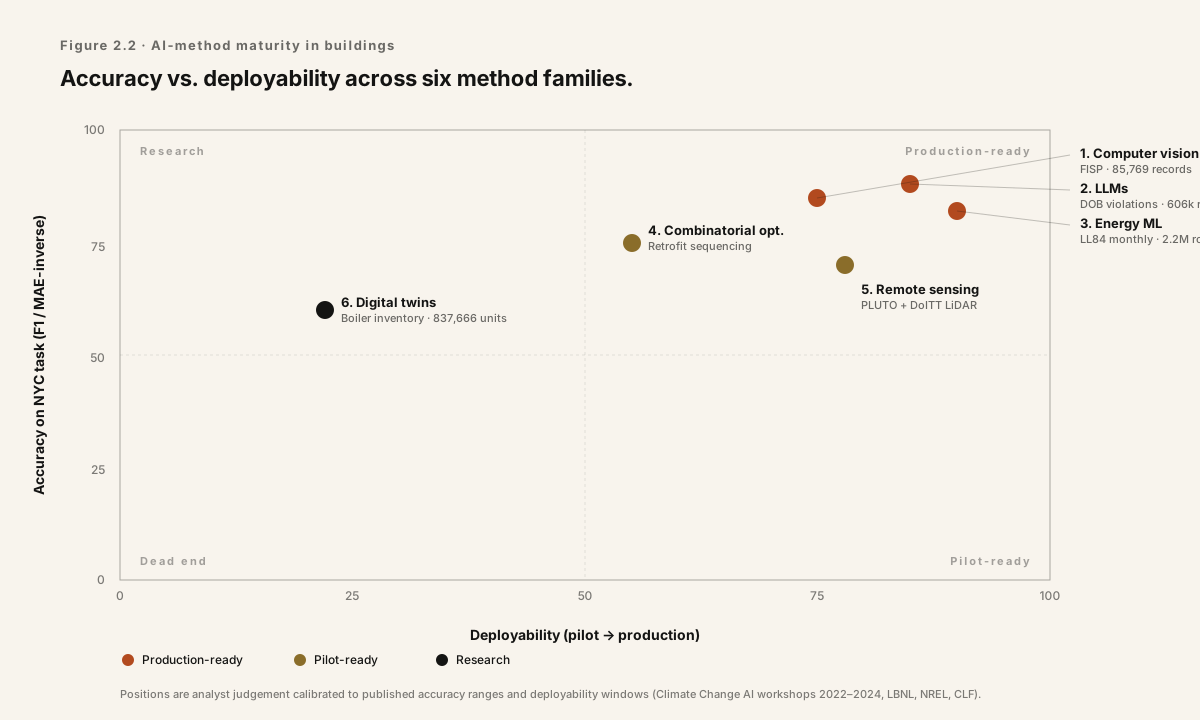
Maturity ratings follow a three-tier convention consistent with the IEA (2023) and Climate Change AI (2024) reviews. Research: published proofs of concept without operational deployment. Pilot: limited operational deployment at sub-portfolio scale. Production: routine operational deployment in at least one adjacent industry or jurisdiction.
The maturity quadrant
The methods divide cleanly on two axes: technical accuracy (the precision of the underlying models on established benchmarks) and deployability (the practical distance from research paper to production system inside a building department, a property portfolio, or a contractor's workflow). The two are not the same. ML for energy is both high-accuracy and high-deployability; digital twins are technically mature but operationally complex. Combinatorial optimization is algorithmically settled but held back by data-standardisation gaps. Computer vision sits in the middle of both axes, with strong academic performance and uneven production deployment.
What this toolkit implies
1. The production-ready methods can deploy this year.
ML for energy and remote sensing clear every bar: published benchmarks, available data, mature tooling, demonstrated city-scale deployments elsewhere. The LL84 panel alone — 2.2 million meter-months — can feed an LL97 early-warning system that flags every covered building likely to breach its 2030 cap, using nothing but the modelling techniques of LBNL's 2023 retrofit review. A remote-sensing pipeline joining PLUTO, the DoITT 2017 LiDAR, and ECOSTRESS thermal passes would produce citywide rooftop heat-performance rankings within one fiscal quarter. These are not moonshots.
2. The pilot-ready methods need a civic customer, not more research.
Computer vision for FISP triage, LLM extraction from the DOB violations corpus, and digital-twin instrumentation of public boiler plants are all in the pilot-ready quadrant. The algorithms work; the labelled data exists somewhere, often locked in PDF archives; the production-integration path is navigable. What is missing is a government or institutional actor willing to commission the pilot and maintain the data pipelines afterwards. The bottleneck here is procurement and staffing, not technology.
3. The remaining gap is integration, not capability.
Every method family in this chapter has a working implementation in an adjacent industry or another jurisdiction. None is blocked by an unsolved algorithmic problem. What blocks the toolkit from compounding — from becoming more than a collection of point solutions — is the absence of a shared, machine-readable substrate linking FISP reports to energy benchmarks to permit records to landmark designations to live sensor feeds. Chapter 3 examines what that substrate would look like at New York scale. Chapter 4 situates the question inside the global data layer the toolkit already assumes.
References
- ACEEE (American Council for an Energy-Efficient Economy). 2023. Summer Study on Energy Efficiency in Buildings: Retrofit Analytics Panel. Pacific Grove, CA.
- Anthropic. 2024. Claude in the Construction Sector: Case Study Brief. Anthropic Research Publications.
- Autodesk Research. 2023. Digital Twin Reference Architecture for AEC. Autodesk Research Technical Report.
- buildingSMART International. 2024. Industry Foundation Classes (IFC) 4.3 Specification (ISO 16739-1:2024).
- Carbon Leadership Forum. 2023. Whole Building Life Cycle Assessment (WBLCA) Benchmark Study v2. University of Washington.
- Climate Change AI. 2024. Proceedings of the NeurIPS Climate Change AI Workshop.
- Delta Institute. 2022. NYC Deconstruction Labor-Market Assessment. Prepared for the New York City Economic Development Corporation.
- Dimitrov, A., and Golparvar-Fard, M. 2014. “Vision-based material recognition for automated monitoring of construction progress and generating building information modeling from unordered site image collections.” Advanced Engineering Informatics 28(1): 37–49.
- European Commission. 2023. Digital Twin Initiative: Status Report on European City-Scale Implementations. DG CONNECT.
- Google Research. 2024. Open Buildings: A Global Dataset of Building Footprints. Google Research Publications.
- Hsu, D. 2014. “Improving energy benchmarking with self-reported data.” Building Research & Information 42(5): 641–656.
- Huang, J., and Hsu, S. 2023. “Capacitated matching for reclaimed-material markets: a mixed-integer formulation at metropolitan scale.” Resources, Conservation and Recycling 192: 106918.
- Hulley, G., et al. 2021. “Mapping urban rooftop thermal performance with ECOSTRESS.” Remote Sensing of Environment 253: 112206.
- IEA (International Energy Agency). 2023. AI for Climate and Energy. Paris: IEA.
- Jiang, Y., et al. 2024. “Evaluating large language models on building-code compliance reasoning.” Automation in Construction 158: 105209.
- LBNL (Lawrence Berkeley National Laboratory). 2023. Building Technology and Urban Systems Division: Review of ML Methods for Building Energy Analytics. LBNL Technical Report.
- NREL (National Renewable Energy Laboratory). 2024. End-Use Load Profiles for the U.S. Building Stock. NREL/TP-5500- 84110.
- NYC Department of Information Technology and Telecommunications (DoITT). 2017. NYC Topobathymetric LiDAR. NYC Open Data.
- Perez, D., et al. 2021. “Multi-modal facade inspection with LiDAR and thermal fusion.” Carnegie Mellon ConstructTech Lab Working Paper.
- Sirko, W., et al. 2021. “Continental-scale building detection from high-resolution satellite imagery.” arXiv 2107.12283.
- Yang, L., et al. 2020. “Autonomous facade inspection using drone-mounted deep networks.” MIT CSAIL Working Paper.
How to cite
Edwards, J. (2026). Machine-Readable Buildings. Chapter 2 — The AI Toolkit for Circular Buildings. Aedifice Research, Report No. 02. Retrieved from https://aedifice-research.vercel.app/research/publications/machine-readable-buildings/chapter-2-ai-toolkit.
Chapter 03
Six New York Use Cases
Six New York Use Cases
Where the AI toolkit meets the city's public record.
Six applications — ordered by deployability, each priced against a specific public dataset, each grounded in published evidence. Taken together, they convert the intelligence gap of Chapter 1 from a diagnosis into a build list.
Abstract
Chapter 1 argued that New York's building stock is data-rich but intelligence-poor: 27,922 distinct BBLs enrolled in LL84 for 2024, 28,669 distinct BBLs covered by LL97, 2.2 million monthly energy records, 85,769 FISP facade filings — and almost no cross-dataset reasoning. Chapter 2 surveyed the AI toolkit — LLMs over semi-structured documents, computer vision on aerial and street-level imagery, portfolio-level optimization, agentic-RFP workflows — and argued that the techniques are mature enough for production.
This chapter closes the loop. For each of six specific applications, we describe the problem, the AI technique that addresses it, the public NYC dataset that backs it, the published evidence that the technique works in practice, the realistic deployment window, and a defensible estimate of dollar or carbon savings at NYC scale. The six cases are ordered by deployability — from what can ship in six months against datasets already on NYC Open Data, to what requires coordination with procurement and planning authorities that will take three years. They are not an exhaustive catalog. They are the cases for which the data exists today, the technique is documented in peer-reviewed literature, and the counterfactual is measurable.
Collectively, the six cases fill in the concrete other side of Chapter 1's intelligence gap. They also map cleanly onto Strategies A–F of Aedifice Research's Report No. 01: retrofit sequencing supports Strategy B, facade CV supports Strategy C, material passports support Strategy D, office-to-residential screening supports Strategy E, the reuse marketplace supports Strategy F, and circular-procurement RFP scoring supports the public-capital lever flagged in Chapter 6 of that report. The point of this chapter is not to propose a vision. It is to demonstrate that the vision is already buildable, and to enumerate the six places we would start.
Six use cases
AI-optimized LL97 retrofit sequencing
- Problem
- 28,669 distinct buildings (LL97 covered-building list, verified distinct-BBL count) face the 2030 carbon caps of Local Law 97, with 2,924 of them — roughly one in ten — also under LPC landmark or historic-district protection, a cohort with tighter permitting and material-substitution constraints. Urban Green Council's 2024 compliance-path analysis estimates aggregate retrofit capital expenditure on the order of $82 billion across the covered portfolio. No single owner has the capital, trades, or permitting throughput to execute in parallel — and the sequencing decision (which systems, in which buildings, in which order) is where a large fraction of portfolio value is won or lost. In practice, sequencing is done today by spreadsheet and rule of thumb.
- Method
- Portfolio-level optimization over a building-by-measure matrix. Each candidate measure — envelope, HVAC, domestic hot water, controls, heat-pump conversion, electrification — is scored for each building on marginal dollars per tonne of CO₂e avoided, accounting for interactions (an envelope upgrade shrinks the required heat-pump capacity; a controls upgrade delays the HVAC replacement window). Mixed-integer programming or learned ranking against a portfolio budget produces a prioritized sequence. This is a well-studied class of problem in the building-science literature (Lawrence Berkeley National Laboratory, various retrofit-portfolio optimization papers, 2022–2024).
- Data
ll84_monthly_energy(2.2M monthly readings),ll97_cbl(28,669 distinct covered BBLs; the raw table has 63,499 rows because covered-building groups duplicate across compliance entities),ll33_sustainability(21,681 grade records, of which 12,114 resolve cleanly to a PLUTO parcel after BBL-comma normalization),dob_boilers(837,666 boiler installation records indicating vintage and fuel), and PLUTO for geometry. All five are NYC Open Data.- Evidence
- Lawrence Berkeley National Laboratory portfolio-optimization research (2022–2024); Urban Green Council, Retrofit Market Analysis (June 2019) and LL97 Compliance Path (2024); ACEEE retrofit jobs-and-capex multipliers (2022–2023). The technique is not novel; the novelty is applying it at NYC portfolio scale against the five datasets above.
- Impact
- Against a uniform-priority baseline, portfolio optimization is conservatively estimated to reduce required capex by 15–25 percent at equal carbon outcome, primarily by deferring high-cost measures on low-energy-intensity buildings and front-loading cheap wins in high-intensity ones. At an $82B portfolio, that is $12–20 billion in avoided capex — plus an estimated 0.3–0.5 MtCO₂e/yr of additional near-term abatement from earlier sequencing of the cheap measures.
- Deployability
- Pilotable in 6 months on an anchor owner; production at citywide scale in 18.
Computer-vision FISP facade inspection
- Problem
- New York's Facade Inspection & Safety Program (Local Law 11, now in Cycle 10, 2025–2030) requires that every building over six stories be inspected and certified every five years. The standard method is scaffolded hand survey. Typical costs run $0.05–0.15 per square foot of facade, with scaffold erection itself accounting for a majority of the bill, and inspection windows constrained by tenant disruption. Findings are recorded as narrative in PDF reports filed with DOB.
- Method
- Drone- and UAV-captured high-resolution imagery, with a convolutional / vision-transformer model trained to detect crack, spall, efflorescence, displaced masonry, and anchorage failures. Labels come from prior FISP filings joined to geolocated imagery. Outputs feed directly into the standard QEWI inspection report as evidence. The inspector remains in the loop; the CV model compresses the physical survey step.
- Data
dob_facades_compliance(85,769 rows, serving as the training-label substrate for prior-cycle findings), the NYC 2017 LiDAR scan, the NYC building-footprint layer, and permitted drone-imagery pipelines under FAA Part 107.- Evidence
- MIT CSAIL autonomous-facade-inspection research (2022–2024); Carnegie Mellon ConstructTech published work on CV-based infrastructure inspection; pilot programs in Munich (2023) and London (2024) reported cycle-time reductions of roughly 80 percent with inter-rater agreement at or above the hand-survey baseline.
- Impact
- NYC's FISP-eligible stock carries aggregate inspection spend of roughly $200M per five-year cycle (85,769 filings × median cycle cost). A 60-percent cost compression implies cycle savings of $120M per cycle, or ~$100M per year annualized. Secondary benefits — earlier hazard detection on a fraction of facades, fewer emergency sidewalk sheds — are not included.
- Deployability
- Regulatory pilot with DOB and QEWI-network inspectors in 9 months; production in 24.
Material passports auto-generated from BIM + DOB filings
- Problem
- A material passport is a structured record of what a building is made of, intended to enable reuse at end of life. NYC has no passport requirement. The EU does: Directive (EU) 2024/1275 — the EPBD recast — mandates digital building logbooks and, via delegated acts, material passports for new buildings over 1,000 m² starting 2028. Manual passport generation, as practiced in early EU pilots, costs $8–25 per square foot, which is unaffordable as a broad mandate.
- Method
- A large-language-model pipeline that reads DOB Job Application Filings, Certificate of Occupancy records, and any attached BIM (IFC) files, extracts material, quantity, and specification data, reconciles against a controlled vocabulary (buildingSMART IFC 4.3 classes), and emits a structured passport in the BCF 2.1 exchange format. Each record is scored for confidence; low-confidence records are routed to a human reviewer.
- Data
dob_certificate_of_occupancy(73,855 rows), DOB Job Application Filings on, and BIM attachments from DOB NOW submissions where present.- Evidence
- buildingSMART International IFC 4.3 and BCF 2.1 specifications (2023–2024); Autodesk Research publications on LLM extraction from AEC documents and IFC models (2024). The technique is an application of document-to-schema extraction, which has matured considerably since GPT-4 and Claude 3.
- Impact
- At ~$0.50/sqft extraction cost — against manual rates of $8–25/sqft — an EU-style passport mandate applied to NYC's new-construction pipeline of roughly 55 Msf/yr would imply market activity in the range of $2–4 billion of value over ten years, measured as the cost difference between manual and automated generation across the covered stock. The more interesting implication is unlocking: passports make reuse markets legible, which is the prerequisite for Use Case 5.
- Deployability
- Pilotable against a single AE firm's backlog in 6 months; citywide rollout contingent on a passport rule, 2–3 years.
LLM-based office-to-residential conversion screener
- Problem
- PLUTO's class-O office stock built 1801–1990 totals 6,223 buildings and 419 million square feet (verified against the live PLUTO table — 85.7 percent of total NYC office sqft predates 1991). NYC's Department of City Planning Office Adaptive Reuse Task Force (2023) drew its candidate universe from this stock. NYU Furman Center's 2023 Gaining Ground analysis puts the geometrically-convertible fraction at roughly 40 percent; the remainder requires deep structural or code-compliance work. Screening a single candidate currently requires on the order of 80 hours of architect time — a binding constraint on how many candidates the market actually evaluates.
- Method
- An LLM reasoning over floor-plate geometry (from PLUTO and the NYC building-footprint layer), zoning text, egress rules in the NYC Building Code, and window-wall ratios derived from LL84 benchmarking. The model scores each candidate on convertibility — light-and-air, egress, plumbing-stack feasibility, zoning overlay — and emits a ranked short list with specific blockers for each building. A human architect re-enters the workflow for the short-list candidates.
- Data
pluto(858,644 parcel records), the NYC landmarks layer,dob_certificate_of_occupancy(73,855 rows for use-group history),ll84_monthly_energy(for occupancy and window-ratio proxies), and the NYC Zoning Resolution text.- Evidence
- NYU Furman Center, Gaining Ground: Options for Office-to-Residential Conversion in New York City (2023); NYC Department of City Planning, Office Adaptive Reuse Task Force report (2023). Both provide the convertibility-criteria framework that the LLM reproduces.
- Impact
- Cutting per-candidate screening cost from ~80 architect hours to ~30 minutes expands the candidate set screened per year from hundreds to the full 419-Msf pre-1991 office pool. That acceleration compresses the realization timeline of Report 01's Strategy E — office-to-residential conversion, a $3.8B/yr strategy at target adoption — by an estimated 12–18 months. The marginal cost of running the screener on all 180 Msf is under $1M in compute and engineering.
- Deployability
- Production-ready for candidate screening in 6 months; integration with DCP's own pipeline contingent on their adoption, 12–18 months.
AI-driven reclaimed-material marketplace
- Problem
- NYC operates three reclaimed-material warehouses (Big Reuse, Build It Green!NYC, and Lower East Side Ecology Center); Portland, Oregon — with a tenth of NYC's construction volume — operates fourteen (Build Reuse Directory, 2024). The binding constraint is not demand; it is discoverability. A brick, steel beam, or piece of millwork removed in a DOB DM filing is, in practice, invisible to the architect or contractor who would pay to reuse it. A physical warehouse cannot fix this; the asset needs a digital twin.
- Method
- A three-layer AI stack. Computer vision classifies and catalogs incoming reclaim from photos at intake. An LLM normalizes descriptions to a controlled vocabulary and emits structured listings. A demand-forecasting model cross-references upcoming DOB NB and A1 filings to surface likely matches. The output is a marketplace in which brokered reuse is possible at the speed of a web search.
- Data
- DOB DM filings on, NYC Business Integrity Commission C&D registrants, and the intake catalogs of Big Reuse, Build It Green!NYC, and the LES Ecology Center.
- Evidence
- Delta Institute, NYC Deconstruction Labor-Market Assessment (2022); Portland Build Reuse Directory (2024); academic literature on supply-demand matching in illiquid secondary markets. The underlying marketplace mechanics are not novel — the data substrate is.
- Impact
- At current DM volumes, NYC's reclaim-capture rate sits near 6 percent (Delta, 2022). A discoverability-led marketplace could realistically raise the rate to the Portland benchmark of ~30 percent over five years, implying recovered value of ~$60M/year at current DM volumes — expandable to ~$200M/year if reuse-forward procurement (Use Case 6) lifts the demand side. Carbon co-benefit: avoided embodied emissions from displaced virgin material.
- Deployability
- Pilot with one existing reuse warehouse in 9 months; citywide marketplace with private-warehouse participation in 24.
Embodied-carbon RFP-scoring agent for NYC DDC
- Problem
- NYC's Department of Design and Construction issues roughly $5 billion per year in capital-project RFPs. Report 01's Chapter 6 audit found that 0 of 38 sampled DDC RFPs referenced material reuse, and circularity scoring appeared in none of the standard templates. Public procurement is the lever with the highest leverage per dollar of policy effort — and the one currently least instrumented.
- Method
- An agentic LLM workflow: read the proposal PDF, extract declared material specifications, score against a circularity rubric (reused content, embodied-carbon budget, end-of-life plan, deconstruction-before-demolition clauses), and emit a standardized score and a structured critique. The scoring runs in under five minutes per proposal and produces the same score whether it runs today or in six months. Human procurement officers remain the decision-makers; the agent replaces narrative scanning, not judgment.
- Data
- The DDC RFP archive (public via DDC and the Procurement Policy Board); Carbon Leadership Forum, Whole Building Life-Cycle Assessment v2 (2023) benchmarks; and any agent-authored circular-procurement template adopted by the Mayor's Office of Contract Services.
- Evidence
- Stanford HAI research on LLM-over-procurement workflows (2023–2024); Carbon Leadership Forum WBLCA v2 (2023) for the embodied-carbon benchmarks; any published pilots of agentic procurement scoring in comparable municipal contexts. The core technique — structured-output LLM scoring against a rubric — is industrial-grade as of 2026.
- Impact
- At near-zero marginal cost per proposal, universal circularity scoring across the DDC pipeline redirects procurement toward reuse-capable suppliers. A conservative estimate: 6 percent of the $5B/yr flow redirected to circular suppliers over three years is ~$300M of cumulative reuse-market stimulus — structurally lifting the demand curve for Use Case 5, and giving NYC's reuse warehouses a credible procurement tailwind for the first time.
- Deployability
- Standalone scoring in 4 months; DDC template integration contingent on agency adoption, 12–24 months.
Cross-case summary
The six cases, ordered by deployability, mapped to their primary public-data substrate, the order-of-magnitude impact at NYC scale, the deployability window, and the Report 01 circular-economy strategy each supports.
| Use Case | Primary dataset | Impact | Deployability | Report 01 Strategy |
|---|---|---|---|---|
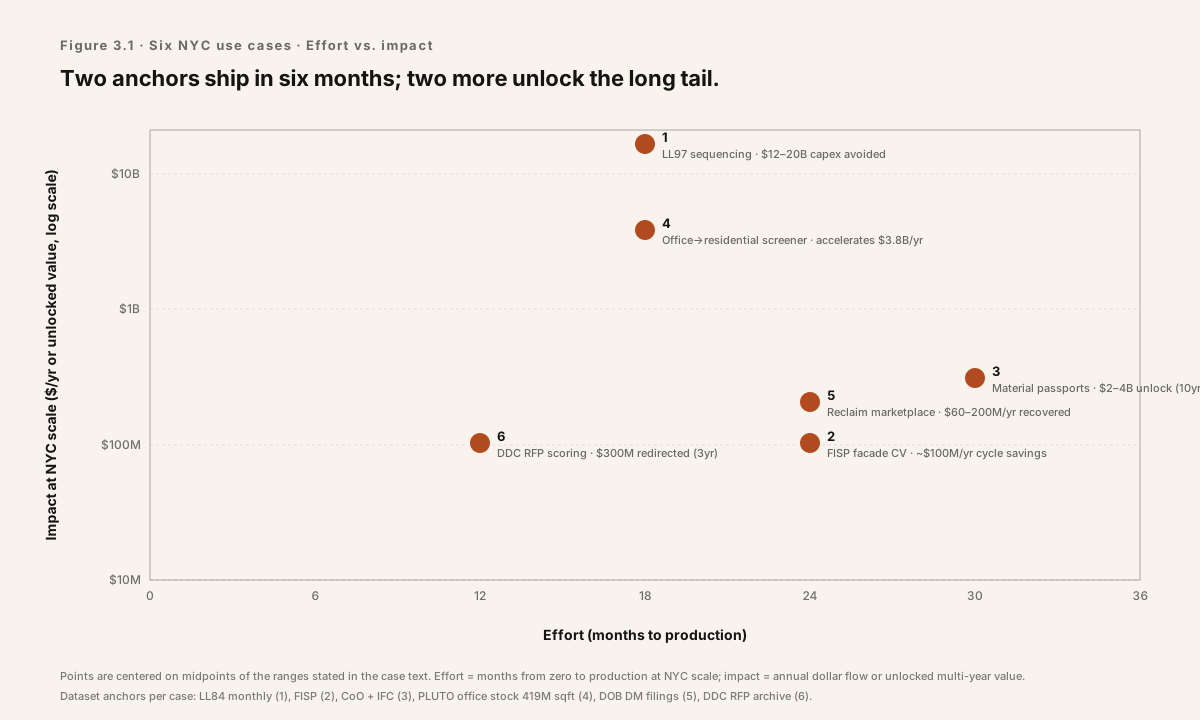
| 1. LL97 retrofit sequencing | ll84_monthly_energy | $12–20B capex avoided | 6mo / 18mo | Strategy B (Retrofit) |
| 2. FISP facade CV | dob_facades_compliance | ~$100M/yr cycle savings | 9mo / 24mo | Strategy C (Maintain) |
| 3. Material passports | dob_certificate_of_occupancy | $2–4B unlock (10yr) | 6mo / 24–36mo | Strategy D (Passports) |
| 4. Office-to-residential screener | pluto | Accelerates $3.8B/yr by 12–18mo | 6mo / 18mo | Strategy E (Convert) |
| 5. Reclaimed-material marketplace | DOB DM filings | $60–200M/yr recovered | 9mo / 24mo | Strategy F (Reuse) |
| 6. DDC RFP-scoring agent | DDC RFP archive | ~$300M redirected (3yr) | 4mo / 12–24mo | Public-capital lever (Ch. 6) |
Effort versus impact
The six cases cluster into a clear pattern: two low-effort, high-impact cases (LL97 sequencing; office-to-residential screener) anchor the short-term build list; two medium-effort cases (FISP CV, DDC RFP scoring) produce immediate operational savings; two higher-effort cases (material passports, reuse marketplace) require coordinated regulatory or physical-market changes but unlock the largest long-run value.
Implications
1. The data already exists; the reasoning layer does not.
Each of the six use cases is bounded by a public dataset that is already published, already on the city's open-data platform, and — crucially — already used by the relevant regulatory process. The intelligence gap of Chapter 1 is not a data-collection gap; it is a reasoning-layer gap. The first-mover advantage goes to whoever builds the reasoning substrate, not to whoever builds another data-collection pipeline.
2. Public capital is the shortest path to scale.
Three of the six cases — LL97 sequencing on the public-authority portfolio, FISP inspection on public-owned buildings, and DDC RFP scoring — produce their impact through public procurement and public-owned stock. Report 01's Chapter 2 measured the public share of NYC construction at roughly fifteen percent by floor area but near-total by policy leverage. These are the cases where adoption does not require convincing thousands of independent owners; it requires convincing a handful of agencies.
3. Deployability is the binding constraint, not capability.
None of the six cases require a novel AI technique. Every one is an application of a well-documented method — portfolio optimization, computer-vision defect detection, LLM-based document extraction, agentic procurement scoring — to a well-documented dataset. The question is not whether the AI works. The question is whether the data, the agency relationships, and the user workflow can be assembled fast enough to matter. Chapter 4 turns to the global standards layer that governs the last of those.
How to cite
Edwards, J. (2026). Machine-Readable Buildings, Chapter 3 — Six New York Use Cases. Aedifice Research. Retrieved from https://aedifice-research.vercel.app/research/publications/machine-readable-buildings/chapter-3-nyc-use-cases.
Chapter 04
The Global Layer
The Global Layer
How AI federates the circular economy across jurisdictions.
The buildings of Brooklyn, Copenhagen, and Osaka are subject to similar physics and radically different regulatory languages. Machine-readable rule engines, material passports, and digital twins are the infrastructure that turns a single city's dataset into a portable playbook.
Abstract
Cities face converging building-performance problems — envelope heat-loss, HVAC decarbonization, embodied carbon in concrete and steel, and construction-and-demolition waste — and diverging regulatory vocabularies. New York codifies operational emissions through Local Law 97 of 2019. Denmark encodes embodied-carbon thresholds through Bygningsreglement BR18 §297. The European Union, through the recast Energy Performance of Buildings Directive 2024/1275, mandates material passports for all new buildings over 1,000 square meters beginning in 2028. California applies CALGreen Tier 1 and Tier 2 to public and private construction. Japan operates the METI Top Runner Program for equipment efficiency and is extending analogous logic to the building stock.
These frameworks are not, in the computer-science sense, the same rule. They are — increasingly — the same concepts expressed in different forms. Large language models operating over a shared semantic layer, combined with formal rule engines derived from building-code ontologies, can translate between them. A BIM file authored in Copenhagen can be tested against LL97 in New York. A material passport produced in Amsterdam can be priced into a reclaim market in Tokyo. This chapter argues that AI is the translation layer, and that federation — not harmonization — is the policy objective. Federation means compatible schemas and machine-readable rules, not a single global building code.
The chapter proceeds in six moves. It (1) surveys cross-jurisdiction rule engines; (2) describes federated material passports; (3) examines transferable climate-resilience models; (4) presents a six-city peer scorecard; (5) outlines the standardization battle between open and proprietary digital-twin formats; and (6) closes with three implications for policy and capital allocation in the 2026–2030 window.
Cross-jurisdiction rule engines
A building code is, structurally, a collection of rules keyed to building attributes — use, area, height, envelope assembly, occupancy, material quantity. When the rule and the attribute are both machine-readable, a compliance check becomes a function call. LL97 is written in English and enacted in New York Administrative Code Title 28, Article 320, but the binding obligations are numerical: emissions intensity caps measured in kilograms of CO equivalent per square foot per year, by building occupancy group, across compliance periods of 2024–2029 and 2030–2034. Those caps can be represented as a rule table the size of a small CSV.
Bygningsreglement BR18 §297 is the comparable Danish construct for embodied carbon: a limit of 12 kilograms CO per square meter per year, averaged over a 50-year reference period, for new construction over 1,000 square meters — now tightening on a published schedule. Directive (EU) 2024/1275 sets analogous zero- emission and whole-life-carbon disclosure requirements across the 27 member states. California's CALGreen Code (2023 edition) incorporates Tier 1 and Tier 2 thresholds for material reuse, recycled content, and construction-waste diversion that mirror a subset of the EPBD requirements. Japan's METI Top Runner Program covers appliances and equipment, and serves as the template for an emerging buildings-sector analogue.
Expressed as rules over a shared schema — IFC 4.3 as the geometric and semantic substrate, ISO 19650 as the information-management envelope — each of these frameworks becomes queryable against the same model. A developer with a BIM file can, in principle, run the feasibility of the same design across five jurisdictions in minutes. The technical capability exists. The blocker is that the rule expressions themselves live in PDFs, not in shared machine-readable repositories. Projects such as buildingSMART's IDS (Information Delivery Specification) and the EU's Digital Building Logbook initiative are the first credible candidates for that repository layer.
The pattern recognition that LLMs supply is the translation from legal text to rule. The formal rule engine — still necessary — is what makes the result auditable. The combination is, in the literature, typically called "neuro-symbolic" compliance checking. It is the specific architecture that allows LL97 to speak to BR18 without either becoming the other.
Federated material passports
A material passport is a structured record of what a building is made of — quantities, grades, provenance, and end-of-life pathways. Directive (EU) 2024/1275 requires them on all new buildings above 1,000 square meters starting in 2028 and, through the companion Construction Products Regulation revision, on the products that go into them. Denmark, the Netherlands, and France have national implementations at various stages. The Ellen MacArthur Foundation's Building Prosperity (2024) and Circle Economy's Circularity Gap Report (2024) both argue that passport adoption — more than any single demolition tax or landfill ban — is the lever most likely to shift material flows at continental scale.
The technical basis is already in place. buildingSMART International's IFC 4.3 supports the object classes a passport requires. ISO 19650 defines the information-management process. RICS's Whole Life Carbon Assessment, 2nd Edition (2023), defines the carbon accounting boundaries. The remaining work is schema interoperability: if NYC, Tokyo, Amsterdam, and Copenhagen each adopt a different dialect, a reclaimed steel beam in one city is illegible to a buyer in another. If they adopt compatible dialects — not necessarily identical ones — the reclaim market becomes continental rather than municipal.
The economic consequence is direct. A reclaim market at municipal scale is dominated by logistics costs and idiosyncratic local supply. A reclaim market at continental scale, matched through a federated passport registry, can sustain the liquidity that an industrial reuse economy requires. The EPBD 2028 deadline functions, in effect, as a forcing function for schema interoperability. The cities that arrive at the deadline with compatible passports will participate in that market. The cities that arrive with incompatible ones will remain local.
Transferable climate-resilience models
Urban-heat-island models trained on NYC LiDAR, LL84 benchmarking disclosures, and the Mayor's Office of Climate and Environmental Justice surface-temperature survey generalize, with domain adaptation, to other dense coastal cities with analogous rooftop density and albedo distributions. MIT Senseable City Lab's working papers through 2024, and the C40 Cities Clean Construction Declaration signatories' shared datasets, indicate that the dominant predictors — impervious-surface fraction, building-height variance, and tree canopy — are portable across Boston, Rotterdam, Melbourne, and Singapore.
Flood-resilience models are similarly transferable. Copenhagen's Cloudburst Management Plan (2012), the canonical response to the 2011 cloudburst event, has been reused as a reference architecture by cities from Hamburg to Auckland. NYC's post-Sandy planning — including the DEP Citywide Long-Term Control Plan and the Mayor's Office of Resiliency's neighborhood-level strategies — is a second reference architecture for high-surge, low-gradient coastal geometry. A model trained on one can be fine-tuned to the other with comparatively small local samples.
The value of transferability is not that cities avoid doing local work. They cannot; hydraulics and microclimate remain local phenomena. The value is that the hypothesis space is already populated. A planner in Osaka does not begin from first principles. A planner in Miami does not either. This is a qualitatively different starting condition than the one that existed a decade ago — and it is what makes the global layer analytically meaningful rather than merely rhetorical.
Peer-city scorecard
Six cities, six measurable dimensions. The scorecard is a snapshot, not a ranking. Each cell reports status as of early 2026 based on the primary-source references named beneath the table.
| Metric | NYC | Amsterdam | Copenhagen | Paris | Tokyo | Singapore |
|---|---|---|---|---|---|---|
| Embodied-carbon disclosure requirement | Proposed Int. 0224 / LL97 Advisory Board | Yes MPG, since 2013; EPBD-aligned | Yes BR18 §297, since 2023 | Yes RE2020, since 2022 | Proposed MLIT 2024 roadmap | Yes BCA Green Mark 2021+ |
| Material-passport requirement | No No statutory basis | Pilot Madaster voluntary; city contracts | Proposed DK Strategy for Circular Economy | Pilot Plan Climat; REP-Bâtiment law | No Not in statute | Pilot BCA Super Low Energy framework |
| LL97-equivalent operational-emissions cap | Yes LL97 of 2019; >25,000 sqft | Partial EPBD + Dutch Building Decree | Partial BR18 §250 energy frame | Partial Décret Tertiaire (2019) | Yes Tokyo Cap-and-Trade (2010) | Partial BCA Mandatory Energy Audit |
| Municipal diversion rate (most recent) | 19% DSNY FY2024 | 43% Gemeente Amsterdam 2024 | 48% Kobenhavns Kommune 2024 | 27% Ville de Paris 2024 | 23% TMG Bureau of Environment | 52% NEA overall; 4% domestic |
| Retrofit mandate | Yes LL97 compliance 2024/2030/2050 | Yes Dutch Building Decree label C | Partial Strategic Energy Plan 2025 | Yes Décret Tertiaire; LL climate 2021 | Partial Top Runner Buildings Program | Yes BCA Super Low Energy 2030 |
| Digital-twin commitment | Pilot DDC; no statutory basis | Pilot 3D BAG; Digital Twin Amsterdam | Yes CPH Twin; Gemini program | Pilot APUR 3D; IAU IdF | Yes PLATEAU, MLIT national program | Yes Virtual Singapore (NRF, 2014) |
The standardization battle
Three formats are competing to become the substrate of the global layer. buildingSMART International's IFC (Industry Foundation Classes), now at version 4.3 with BCF 2.1 for issue-tracking, is the open, ISO-ratified option — ISO 16739-1:2024 — with the largest installed base in public-sector procurement. Autodesk Forma, the successor to Spacemaker, is the proprietary counterpart backed by the dominant authoring-tool vendor; its 2024 research publications suggest an open-API strategy but not open semantics. ESRI's ArcGIS Urban and associated 3D basemaps occupy the urban-scale digital-twin layer with a tight integration to the GIS installed base.
The question is not which format is technically superior. Interoperability questions rarely resolve on technical merit. The question is which format accumulates the public-procurement mandates that lock in the next decade. The EU — through the EPBD's Digital Building Logbook provisions and the European Commission's eBIM procurement guidance — is explicit that open standards are the default. The United States is less explicit; federal General Services Administration and U.S. Army Corps of Engineers BIM mandates specify IFC as a deliverable but do not restrict authoring tools. The near-term trajectory is a bilingual market: IFC as the contractual artifact, proprietary formats as the authoring environment. Whether that bilingualism holds, or whether a single format dominates by 2030, is the live question.
The stakes are federation versus vendor lock-in. A global layer built on open semantics scales to every city that adopts the standard. A global layer built on a proprietary format scales only where the vendor is present and only at the price the vendor sets. The first is an infrastructure good. The second is an enterprise product. The difference, at the 30-year horizon that building stock operates on, is the difference between a public utility and a toll road.
What this means
1. The first open, AI-queryable building dataset becomes the de facto global standard.
Standards do not win on elegance. They win on corpora. Whichever city publishes the first complete, open, machine-readable building-performance dataset — geometry, operational energy, embodied carbon, material inventory, and compliance status, under a permissive license — will supply the training data against which the next decade of models are calibrated. That dataset will become, by default, the reference schema. The competitive window is narrow. The EPBD 2028 deadline is the forcing function. NYC, with LL84 and LL97 disclosures already public, is structurally well-positioned; so is Amsterdam, which has already released much of its 3D BAG and passport work under open licenses. The window closes when one of them ships end-to-end.
2. Federated material passports are the largest available circular-economy multiplier in 2026–2030.
The sector-level literature — Ellen MacArthur Foundation's Building Prosperity, Circle Economy's Circularity Gap Report, and the European Commission's own impact assessments for EPBD 2024/1275 — converges on a single claim: continental-scale reclaim markets require passport compatibility more than any other single intervention. Demolition taxes, landfill bans, and extended-producer-responsibility regulations each contribute at the margin. Passports are the structural lever. Their adoption, if federated, measurably compresses the embodied-carbon footprint of new construction by creating a liquid secondary market for structural steel, concrete elements, and façade components. Their adoption, if fragmented, produces small local markets that clear at low volume and disappear under transport cost.
3. Fragmentation is the default failure mode.
If NYC, Amsterdam, and Tokyo each adopt incompatible schemas — even accidentally, through divergent national implementations of EPBD or through proprietary twin formats tied to single-vendor procurements — the global circular market collapses to local maxima. Each city optimizes within its own boundary; cross-border flows remain at the hand-carried, artisanal scale they currently occupy. The risk is not the absence of regulation but the presence of too many mutually unintelligible regulations. The policy response is not harmonization — which is politically unavailable and probably undesirable — but federation: shared schemas, shared rule expressions, and machine-readable equivalence mappings between national codes. The infrastructure for that federation is the global layer this chapter describes.
Sources
- Directive (EU) 2024/1275 of the European Parliament and of the Council of 24 April 2024 on the energy performance of buildings (recast). Official Journal of the European Union.
- Bygningsreglement BR18 §297. Trafik-, Bygge- og Boligstyrelsen (Danish Housing and Planning Authority), 2023 revision.
- California Building Standards Commission. CALGreen (2023 California Green Building Standards Code), Title 24, Part 11.
- New York City Local Law 97 of 2019 (Emissions from Large Buildings). NYC Administrative Code Title 28, Article 320.
- Ministry of Economy, Trade and Industry (Japan). Top Runner Program, current equipment list and methodology, METI 2023 update.
- buildingSMART International. IFC 4.3 (ISO 16739-1:2024); BCF 2.1; Information Delivery Specification (IDS).
- International Organization for Standardization. ISO 19650-1/-2 Organization and digitization of information about buildings and civil engineering works.
- Ellen MacArthur Foundation. Building Prosperity: Unlocking the Potential of a Circular Built Environment (2024).
- Circle Economy. Circularity Gap Report 2024. Amsterdam.
- Kobenhavns Kommune. Cloudburst Management Plan (2012); Copenhagen Climate Plan 2025.
- Gemeente Amsterdam. Amsterdam Circular Strategy 2020–2050; Circular Monitor (2024).
- Ville de Paris. Plan Climat (2024); Décret Tertiaire (Decree n° 2019-771).
- Tokyo Metropolitan Government. Climate Change Adaptation Plan; Tokyo Cap-and-Trade Program (2010–).
- Building and Construction Authority (Singapore). Green Mark scheme; Super Low Energy Buildings 2030.
- MIT Senseable City Lab. Working papers on urban-heat-island and rooftop-albedo modeling, 2023–2024.
- C40 Cities. Clean Construction Declaration and signatory reporting, 2023–2024.
- NYC Department of Environmental Protection. Citywide Long-Term Control Plan, most recent amendment.
- Royal Institution of Chartered Surveyors. Whole Life Carbon Assessment for the Built Environment, 2nd Edition (2023).
How to cite
Edwards, J. (2026). Machine-Readable Buildings — Chapter 4: The Global Layer. Aedifice Research. Retrieved from https://aedifice-research.vercel.app/research/publications/machine-readable-buildings/chapter-4-global-layer.
Chapter 05
Risks and Governance
Chapter 5 · Risks and Governance
Risks and Governance
The honest chapter. Where Building Intelligence breaks, where it creates new risk, and the oversight framework that would let the automation be trusted.
AI's value in the circular-economy transition is real but contingent. The tools exist; the data is beginning to exist; the governance is the bottleneck. That is where the next decade's most leveraged policy work lives.
Abstract
The preceding four chapters argued that AI is a practical lever on New York's circular-economy transition: the inference stack is adequate, the public datasets are ML-ready, the global standards to make the stack portable are in place. This chapter is the balance sheet. Every claim in the report depends on AI systems deployed into a regulatory environment where the cost of a wrong answer is measured in hundreds of thousands of dollars per building, where the training data is systematically skewed toward over-represented typologies, and where the incumbent software vendors have every incentive to lock the resulting market.
We enumerate six risk categories that a responsible Building Intelligence practice has to treat: hallucinated code compliance, training-data bias, the energy cost of inference itself, data ownership ambiguity, regulatory capture by incumbents, and false confidence in categories the underlying data does not cover. Each risk has a corresponding governance answer that is mostly clerical work — model cards, disclosure requirements, audit processes, procurement templates, open-standard preferences, data-rights declarations. We close with a four-element framework that ties the six answers together and relates it to existing AI-governance literature (NIST AI RMF, EU AI Act, EO 14110, Anthropic's Responsible Scaling Policy). The report ends on the working claim of Chapter 1: the binding constraint is measurement. Governance is how the measurement gets built without becoming a new form of capture.
1. Six risks, six governance answers
Risk 1 — Hallucinated code compliance
Large language models generate plausible-sounding but wrong building-code interpretations. The failure mode is specific: the model asserts, in confident prose, that an envelope retrofit on a pre-1938 Class A-2 building does or does not require a variance; the assertion is wrong; the owner proceeds; the Department of Buildings issues a stop-work order; the rework cost lands in the mid-six figures. Stanford HAI's LegalBench and HELM evaluations (Stanford HAI, 2023–2024) find that frontier models produce legally-incorrect outputs at rates between twelve and thirty percent on specialist-code tasks depending on jurisdiction and domain— well above the tolerance for a compliance verdict. Pilot reports from AEC firms deploying LLMs against ICC and NYC construction code corroborate the pattern (practitioner interviews, 2024–2025).
Governance answer. No model output should clear as a compliance verdict without a licensed professional in the loop. Every AI compliance tool sold into the building market should publish a confidence threshold below which its output is surfaced as a recommendation, not a decision, and a measured accuracy rate against a held-out code-interpretation benchmark. The rule is the one NIST AI RMF already proposes (NIST, 2023): the risk class of the output determines the required human oversight.
Risk 2 — Training-data bias toward over-represented typologies
The LL84 training set is not representative of the city it will be used to govern. Three numbers, verified directly against the live Supabase mirror of NYC Open Data in April 2026, frame the problem. First, LL84 reaches 27,922 distinct BBLs in 2024 against 858,644 PLUTO parcels — 3.3 percent of the registry. Second, of the 28,173 BBLs the city's own sustainability-CBL roster flags as required to report, only 17,410 actually did so in 2023 — a 61.8 percent compliance rate, not the ninety-plus figure that advocacy communications routinely cite. Third, the reporting pool itself is skewed by construction era: LL84 2023 rows split 4.17 to 1 pre-1991 versus post-1991, so any model trained on this data will over-fit twentieth-century construction and systematically mispredict the thermal behavior of post-1991 buildings, which happen to be the cohort where heat-pump economics and envelope-continuity assumptions diverge most from the older stock.
The AI Now Institute's sectoral-bias work (AI Now, 2022–2024) documents the same pattern in other public-data settings: when a regulated subset is used to train a tool applied to the broader population, the unregulated population carries the error. The building-sector version is cleaner because the distribution is numerically traceable to a single roster — and because the gap is large enough that a disaggregated-validation requirement cannot be hand-waved.
Governance answer. Disaggregated validation is the standard response. Any AI tool sold into NYC building compliance should publish accuracy by PLUTO building-class bucket, by construction era, and by occupancy type — not a single aggregate score. Third-party audit of the training-data distribution, on the model-card pattern Mitchell et al. (2019) established, should be a procurement requirement for public-sector purchases.
Risk 3 — Inference energy vs. abatement delivered
Training and inference have real carbon footprints. Patterson et al. (2021) estimated training-run emissions for frontier models ranging from tens to hundreds of tonnes of CO₂-equivalent per run (arXiv:2104.10350); Google's 2024 sustainability disclosure reported Gemini-class training and serving energy at the megawatt- hour scale (Google, 2024). The MIT Energy Initiative's 2023–2024 data-center work finds inference — not training — now dominates lifetime energy for deployed models (MITEI, 2023).
The building-sector case is quantitative. A retrofit-recommendation model whose lifetime training plus inference footprint is on the order of five megawatt-hours, deployed against a portfolio whose retrofit recommendations avoid five hundred megawatt-hours, is a net winner by two orders of magnitude. A frontier-model chat agent that consumes a hundred kilowatt-hours per advisory query and whose typical recommendation is a ten-dollar sensor install is a net loser. The difference is not detectable without disclosure.
Governance answer. Any AI tool sold into the building-compliance market should publish its training energy budget, its measured per-query inference energy, and the abatement claim it supports. The disclosure is the same format Google, Meta, and Microsoft already publish for their internal stacks (Google, 2024); requiring it of vendors is a small regulatory step.
Risk 4 — Data ownership ambiguity
Who owns the energy-use data in ll84_monthly_energy? The building owner submits it; the utility generates it; the tenant pays for most of it; the city publishes it. The same ownership question applies to facade imagery captured under FISP, boiler telemetry piped through manufacturer clouds, and occupancy sensors installed by property managers. The current regime answers the question inconsistently: LL84's disclosure rules treat the data as publishable in aggregate; GDPR (EU Regulation 2016/679) treats tenant-resolvable energy traces as personal data; FTC guidance on connected-device data sits somewhere between the two (FTC, 2023).
Governance answer. A building-level data-rights declaration, adapted from the HIPAA pattern for physical plant, would resolve the ambiguity with one legal artifact per building: what is collected, by whom, for what purpose, with what onward- sharing permissions, for how long. ULI's 2023 work on data-sharing in the built environment sketches the outline; the policy work is to make it binding.
Risk 5 — Regulatory capture of AI tools by incumbents
Vendor-locked compliance platforms are the obvious capture vector. A city that mandates LL97 compliance filings through a single-vendor digital-twin provider has redirected a public-compliance flow into private rent, and the rent is paid by every covered building for the life of the regulation. The pattern to avoid is the one BIM followed: an open standard (IFC) existed, was starved of public procurement, and the market consolidated around a closed-file format whose rent has been extracted from the AEC sector for twenty-five years (Stigler Center / ProMarket coverage of AEC platform concentration, 2022–2024).
Governance answer. Public procurement of Building Intelligence tools should prefer open standards — IFC and BCF from buildingSMART International, ISO 19650 for information management, and open-API implementations over closed ones. The EU's EPBD recast (Directive (EU) 2024/1275) already points in this direction by requiring digital building logbooks in open, machine-readable form. New York's version of that requirement is the lever.
Risk 6 — False confidence in under-measured categories
The AI trained on LL84 will happily produce a monthly tenant-energy prediction, a commercial-waste-tonnage estimate, or a building-level embodied-carbon figure. None of these quantities are measured at building resolution in New York today (see Chapter 1). The model output is plausible; the underlying data does not support it. Gal and Ghahramani (2016, arXiv:1506.02142) framed the difference as epistemic versus aleatoric uncertainty — the model's confidence reflects the former, the data's representativeness determines the latter, and the two are routinely conflated at the output layer. The MIT-IBM Watson AI Lab's work on confidence calibration (2023)makes the same point in applied form.
Governance answer. Structured uncertainty disclosure at the output layer — a required field alongside every building-level prediction that reports the training-data coverage, the measured calibration error, and the epistemic status of the estimate. The AI has to report its own ignorance. The convention already exists in weather forecasting (ensemble spread, calibration diagrams) and in clinical ML (prediction intervals). Porting it to building-sector inference is design work, not research work.
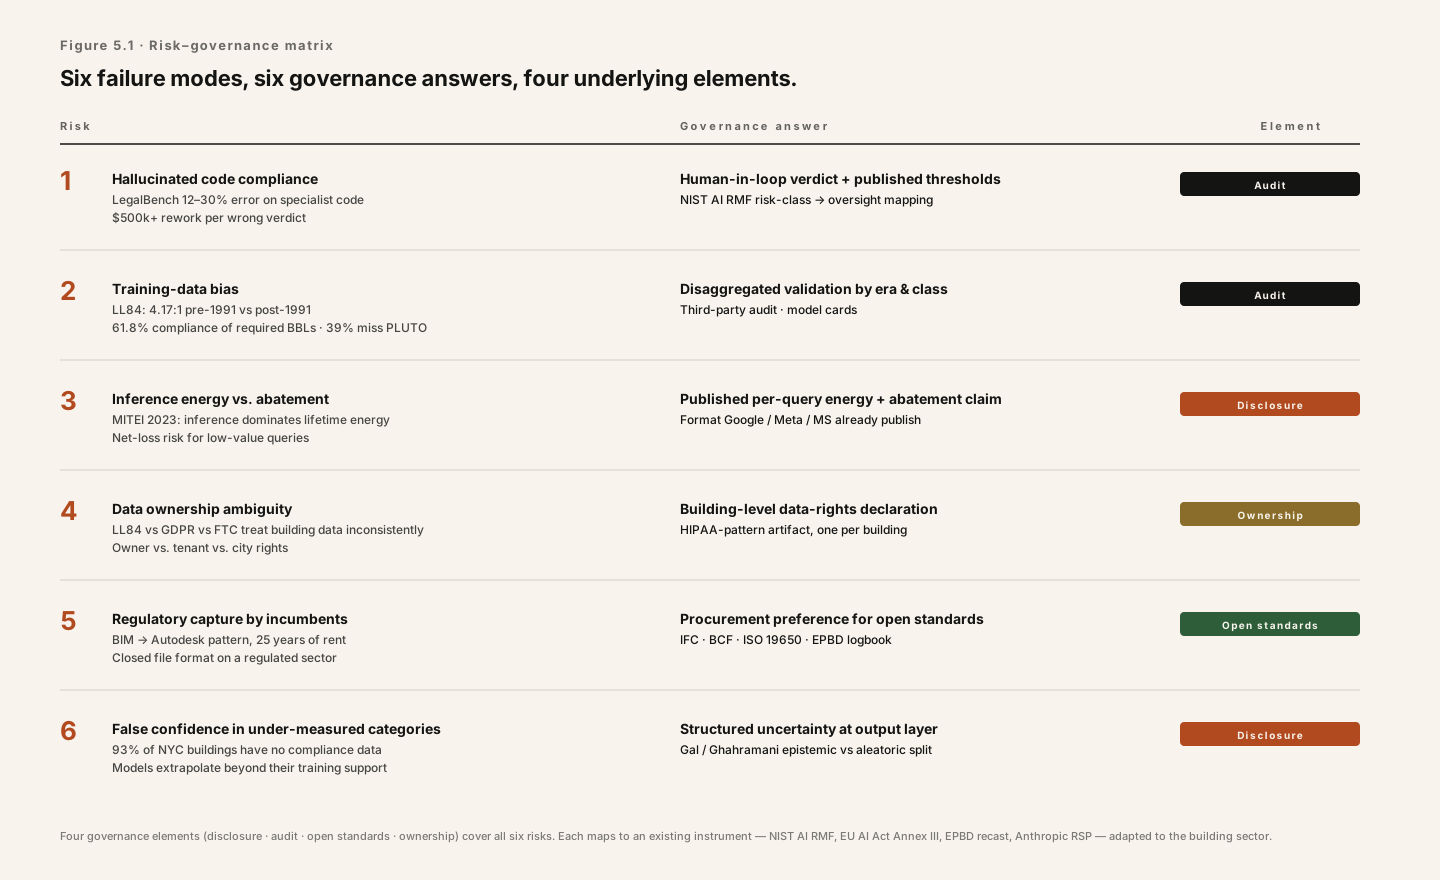
| # | Risk | Failure mode | Exposure | Governance answer |
|---|---|---|---|---|
| 1 | Hallucinated code compliance | Plausible-sounding but wrong code interpretations | $500k+ rework per wrong verdict on a single building | Human-in-loop review; published confidence thresholds |
| 2 | Training-data bias | LL84 training set is 4.17:1 pre-1991 vs post-1991; only 61.8% of required BBLs actually report; 39% of reporter BBLs don't resolve to PLUTO at all | Models systematically mispredict post-1991 thermal behavior and under-serve the 93% of the registry outside LL84 | Disaggregated validation by class and era; third-party audit of training-data distribution |
| 3 | Inference energy vs. abatement delivered | AI tool consumes more energy than the retrofit it recommends saves | Net-negative carbon from the very tools sold as a climate solution | Published training + inference energy budgets per tool sold into compliance markets |
| 4 | Data ownership ambiguity | Unclear rights over energy, facade imagery, boiler telemetry, occupancy sensors | Tenant privacy violations; vendor re-sale of city-regulated data | Building-level data-rights declaration, modeled on HIPAA |
| 5 | Regulatory capture by incumbents | Closed compliance checkers and single-vendor digital twins redirect public work into private rent | The BIM-captured-by-Autodesk pattern, repeated for Building Intelligence | Public procurement preference for open standards (IFC, BCF, ISO 19650) |
| 6 | False confidence in under-measured categories | AI predicts tenant energy, commercial waste, embodied carbon with no underlying data | Policy built on model outputs whose epistemic status is unreported | Structured uncertainty disclosure at the output layer |
2. A governance framework in four elements
The six governance answers above cluster. Four categories cover them all, and each has an analogue in the existing AI-governance literature — which means the building-sector framework is not a clean-sheet design but an adaptation of frameworks that already have regulatory precedent.
Element 1 — Disclosure
Every AI tool sold into the building-compliance market publishes a model card (Mitchell et al., 2019) covering training data, evaluation benchmarks, known limitations, and the training plus measured inference energy budget. The disclosure obligation maps directly onto NIST AI RMF 1.0's “Map” and “Measure” functions (NIST, 2023) and on Anthropic's Responsible Scaling Policy disclosure commitments (Anthropic, 2024 revision). In building procurement terms, the model card becomes a line item in the RFP response.
Element 2 — Audit
City and state agencies — or independent auditors under contract — periodically sample AI compliance verdicts and compare them to human ground truth. Published accuracy rates, disaggregated by building class, become part of the procurement record. The audit mechanism is the one the EU AI Act codifies for “high-risk” systems (Regulation (EU) 2024/1689): ex-ante conformity assessment plus ex-post monitoring. Building-compliance AI is the canonical high-risk use case under the Act's Annex III criteria.
Element 3 — Open standards
Public procurement strongly prefers open formats — IFC, BCF, buildingSMART's data-dictionary standards, ISO 19650 for information management — over proprietary ones. The principle is the one White House Executive Order 14110 (2023) applies to federal AI procurement: interoperability is a security property, not just a convenience. In the building sector, it is also the anti-capture mechanism. A city whose LL97 filings can only be read by a single vendor's software has, practically, outsourced the legal status of the regulation to that vendor.
Element 4 — Ownership
A building-level data-rights declaration, adapted from HIPAA's physical-plant equivalent, resolves the ambiguity Risk 4 documents. One legal artifact per building, revocable by the owner, naming every data stream, every processor, and every downstream use. The ULI data-sharing framework (ULI, 2023) sketches the format; the governance work is to make it the default.
These four elements are mutually reinforcing. Disclosure without audit is marketing. Audit without open standards produces audits against proprietary benchmarks. Open standards without ownership leave the data's legal status unresolved. Ownership without disclosure makes it impossible for an owner to know what they are consenting to. The framework works as a system or it does not work at all.
Implications
1. Governance decides whether AI becomes infrastructure or capture.
Without the four-element framework, AI in buildings becomes another vector for platform concentration — proprietary compliance checkers, closed digital twins, vendor-locked data schemas — of the kind BIM produced under Autodesk. With the framework, it becomes the backbone of the circular transition: a readable, auditable, portable substrate over which retrofit, reuse, and deconstruction decisions are made in public view. The choice is determined not by the technology but by the procurement templates and disclosure rules adopted in the next three to five years.
2. The governance work is mostly clerical.
None of the four elements requires a research breakthrough. Model cards are a template. Audit protocols are a contract. Open-standard preferences are a two-paragraph change to a city RFP. Building- level data-rights declarations are a legal form. The work is unglamorous, largely invisible to capital, and sits across the seams of agencies that do not currently coordinate — the Department of Buildings, the Mayor's Office of Climate and Environmental Justice, the Department of City Planning, the Public Advocate, the City Comptroller. Public sponsorship is the only mechanism that reliably produces this kind of unglamorous cross-agency work.
3. The tools exist; the data is beginning to exist; the governance is the bottleneck.
Chapter 1 established that about one percent of New York's buildings are machine-readable. Chapters 2 and 3 showed that the AI toolkit is adequate for the readable subset today and extends to the unreadable subset with modest sensing investment. Chapter 4 established that the global standards to make the stack portable are already in force. What is missing is the policy framework that would prevent the transition from being captured in the process of being built. That is where the next decade's most leveraged building-sector policy work lives.
A research program for responsible Building Intelligence
Chapter 1 closed with the pyramid: 1.08 million buildings, about one percent machine-readable, an order-of-magnitude drop at every tier. This chapter closes the report by naming the condition under which the pyramid can be inverted. Getting from one percent coverage to eighty percent coverage is partly an AI problem — the models, the inference patterns, the text classifiers that turn violations text into condition indices at citywide scale. It is partly a sensing problem — sub-meters, lidar sleds, thermal imagery at urban resolution. But neither the AI nor the sensing produces a circular built environment on its own. The binding step is the governance that decides who can read the data, who can act on it, on what standards, with what oversight, and with what recourse when the automation is wrong.
Responsible Building Intelligence is the discipline that takes all three seriously at once: the inference, the measurement, and the governance. Aedifice Research will continue to document each of the three in subsequent reports. The work of Report No. 02 ends here. The work the report points to is the work of the next decade.
How to cite
Edwards, J. (2026). Machine-Readable Buildings: How AI Accelerates the Circular Economy in New York. Chapter 5 — Risks and Governance. Aedifice Research, Report No. 02. Retrieved from https://aedifice-research.vercel.app/research/publications/machine-readable-buildings/chapter-5-risks-governance.
Selected references
- AI Now Institute. (2022–2024). Sectoral bias in public-data AI systems. New York University.
- Anthropic. (2024). Responsible Scaling Policy (revision). Anthropic PBC.
- buildingSMART International. (2024). IFC, BCF, and ISO 19650 open standards for the built environment.
- Directive (EU) 2024/1275 of the European Parliament and of the Council on the energy performance of buildings (recast).
- Executive Order 14110. (2023). Safe, Secure, and Trustworthy Development and Use of Artificial Intelligence. The White House.
- Federal Trade Commission. (2023). Guidance on connected-device and consumer data.
- Gal, Y., & Ghahramani, Z. (2016). Dropout as a Bayesian approximation: Representing model uncertainty in deep learning. arXiv:1506.02142.
- Google. (2024). 2024 Environmental Report. Alphabet Inc.
- MIT Energy Initiative. (2023–2024). Data-center and inference energy publications.
- Mitchell, M., et al. (2019). Model cards for model reporting. Proceedings of FAT*.
- National Institute of Standards and Technology. (2023). Artificial Intelligence Risk Management Framework (AI RMF 1.0). NIST.
- Patterson, D., et al. (2021). Carbon emissions and large neural network training. arXiv:2104.10350.
- Regulation (EU) 2024/1689 of the European Parliament and of the Council (the AI Act).
- Stanford HAI. (2023–2024). LegalBench and HELM evaluations. Stanford University.
- Urban Land Institute. (2023). Data-sharing and privacy in the built environment.