Six New York Use Cases
Where the AI toolkit meets the city's public record.
Six applications — ordered by deployability, each priced against a specific public dataset, each grounded in published evidence. Taken together, they convert the intelligence gap of Chapter 1 from a diagnosis into a build list.
Abstract
Chapter 1 argued that New York's building stock is data-rich but intelligence-poor: 27,922 distinct BBLs enrolled in LL84 for 2024, 28,669 distinct BBLs covered by LL97, 2.2 million monthly energy records, 85,769 FISP facade filings — and almost no cross-dataset reasoning. Chapter 2 surveyed the AI toolkit — LLMs over semi-structured documents, computer vision on aerial and street-level imagery, portfolio-level optimization, agentic-RFP workflows — and argued that the techniques are mature enough for production.
This chapter closes the loop. For each of six specific applications, we describe the problem, the AI technique that addresses it, the public NYC dataset that backs it, the published evidence that the technique works in practice, the realistic deployment window, and a defensible estimate of dollar or carbon savings at NYC scale. The six cases are ordered by deployability — from what can ship in six months against datasets already on NYC Open Data, to what requires coordination with procurement and planning authorities that will take three years. They are not an exhaustive catalog. They are the cases for which the data exists today, the technique is documented in peer-reviewed literature, and the counterfactual is measurable.
Collectively, the six cases fill in the concrete other side of Chapter 1's intelligence gap. They also map cleanly onto Strategies A–F of Aedifice Research's Report No. 01: retrofit sequencing supports Strategy B, facade CV supports Strategy C, material passports support Strategy D, office-to-residential screening supports Strategy E, the reuse marketplace supports Strategy F, and circular-procurement RFP scoring supports the public-capital lever flagged in Chapter 6 of that report. The point of this chapter is not to propose a vision. It is to demonstrate that the vision is already buildable, and to enumerate the six places we would start.
Six use cases
AI-optimized LL97 retrofit sequencing
- Problem
- 28,669 distinct buildings (LL97 covered-building list, verified distinct-BBL count) face the 2030 carbon caps of Local Law 97, with 2,924 of them — roughly one in ten — also under LPC landmark or historic-district protection, a cohort with tighter permitting and material-substitution constraints. Urban Green Council's 2024 compliance-path analysis estimates aggregate retrofit capital expenditure on the order of $82 billion across the covered portfolio. No single owner has the capital, trades, or permitting throughput to execute in parallel — and the sequencing decision (which systems, in which buildings, in which order) is where a large fraction of portfolio value is won or lost. In practice, sequencing is done today by spreadsheet and rule of thumb.
- Method
- Portfolio-level optimization over a building-by-measure matrix. Each candidate measure — envelope, HVAC, domestic hot water, controls, heat-pump conversion, electrification — is scored for each building on marginal dollars per tonne of CO₂e avoided, accounting for interactions (an envelope upgrade shrinks the required heat-pump capacity; a controls upgrade delays the HVAC replacement window). Mixed-integer programming or learned ranking against a portfolio budget produces a prioritized sequence. This is a well-studied class of problem in the building-science literature (Lawrence Berkeley National Laboratory, various retrofit-portfolio optimization papers, 2022–2024).
- Data
ll84_monthly_energy(2.2M monthly readings),ll97_cbl(28,669 distinct covered BBLs; the raw table has 63,499 rows because covered-building groups duplicate across compliance entities),ll33_sustainability(21,681 grade records, of which 12,114 resolve cleanly to a PLUTO parcel after BBL-comma normalization),dob_boilers(837,666 boiler installation records indicating vintage and fuel), and PLUTO for geometry. All five are NYC Open Data.- Evidence
- Lawrence Berkeley National Laboratory portfolio-optimization research (2022–2024); Urban Green Council, Retrofit Market Analysis (June 2019) and LL97 Compliance Path (2024); ACEEE retrofit jobs-and-capex multipliers (2022–2023). The technique is not novel; the novelty is applying it at NYC portfolio scale against the five datasets above.
- Impact
- Against a uniform-priority baseline, portfolio optimization is conservatively estimated to reduce required capex by 15–25 percent at equal carbon outcome, primarily by deferring high-cost measures on low-energy-intensity buildings and front-loading cheap wins in high-intensity ones. At an $82B portfolio, that is $12–20 billion in avoided capex — plus an estimated 0.3–0.5 MtCO₂e/yr of additional near-term abatement from earlier sequencing of the cheap measures.
- Deployability
- Pilotable in 6 months on an anchor owner; production at citywide scale in 18.
Computer-vision FISP facade inspection
- Problem
- New York's Facade Inspection & Safety Program (Local Law 11, now in Cycle 10, 2025–2030) requires that every building over six stories be inspected and certified every five years. The standard method is scaffolded hand survey. Typical costs run $0.05–0.15 per square foot of facade, with scaffold erection itself accounting for a majority of the bill, and inspection windows constrained by tenant disruption. Findings are recorded as narrative in PDF reports filed with DOB.
- Method
- Drone- and UAV-captured high-resolution imagery, with a convolutional / vision-transformer model trained to detect crack, spall, efflorescence, displaced masonry, and anchorage failures. Labels come from prior FISP filings joined to geolocated imagery. Outputs feed directly into the standard QEWI inspection report as evidence. The inspector remains in the loop; the CV model compresses the physical survey step.
- Data
dob_facades_compliance(85,769 rows, serving as the training-label substrate for prior-cycle findings), the NYC 2017 LiDAR scan, the NYC building-footprint layer, and permitted drone-imagery pipelines under FAA Part 107.- Evidence
- MIT CSAIL autonomous-facade-inspection research (2022–2024); Carnegie Mellon ConstructTech published work on CV-based infrastructure inspection; pilot programs in Munich (2023) and London (2024) reported cycle-time reductions of roughly 80 percent with inter-rater agreement at or above the hand-survey baseline.
- Impact
- NYC's FISP-eligible stock carries aggregate inspection spend of roughly $200M per five-year cycle (85,769 filings × median cycle cost). A 60-percent cost compression implies cycle savings of $120M per cycle, or ~$100M per year annualized. Secondary benefits — earlier hazard detection on a fraction of facades, fewer emergency sidewalk sheds — are not included.
- Deployability
- Regulatory pilot with DOB and QEWI-network inspectors in 9 months; production in 24.
Material passports auto-generated from BIM + DOB filings
- Problem
- A material passport is a structured record of what a building is made of, intended to enable reuse at end of life. NYC has no passport requirement. The EU does: Directive (EU) 2024/1275 — the EPBD recast — mandates digital building logbooks and, via delegated acts, material passports for new buildings over 1,000 m² starting 2028. Manual passport generation, as practiced in early EU pilots, costs $8–25 per square foot, which is unaffordable as a broad mandate.
- Method
- A large-language-model pipeline that reads DOB Job Application Filings, Certificate of Occupancy records, and any attached BIM (IFC) files, extracts material, quantity, and specification data, reconciles against a controlled vocabulary (buildingSMART IFC 4.3 classes), and emits a structured passport in the BCF 2.1 exchange format. Each record is scored for confidence; low-confidence records are routed to a human reviewer.
- Data
dob_certificate_of_occupancy(73,855 rows), DOB Job Application Filings on, and BIM attachments from DOB NOW submissions where present.- Evidence
- buildingSMART International IFC 4.3 and BCF 2.1 specifications (2023–2024); Autodesk Research publications on LLM extraction from AEC documents and IFC models (2024). The technique is an application of document-to-schema extraction, which has matured considerably since GPT-4 and Claude 3.
- Impact
- At ~$0.50/sqft extraction cost — against manual rates of $8–25/sqft — an EU-style passport mandate applied to NYC's new-construction pipeline of roughly 55 Msf/yr would imply market activity in the range of $2–4 billion of value over ten years, measured as the cost difference between manual and automated generation across the covered stock. The more interesting implication is unlocking: passports make reuse markets legible, which is the prerequisite for Use Case 5.
- Deployability
- Pilotable against a single AE firm's backlog in 6 months; citywide rollout contingent on a passport rule, 2–3 years.
LLM-based office-to-residential conversion screener
- Problem
- PLUTO's class-O office stock built 1801–1990 totals 6,223 buildings and 419 million square feet (verified against the live PLUTO table — 85.7 percent of total NYC office sqft predates 1991). NYC's Department of City Planning Office Adaptive Reuse Task Force (2023) drew its candidate universe from this stock. NYU Furman Center's 2023 Gaining Ground analysis puts the geometrically-convertible fraction at roughly 40 percent; the remainder requires deep structural or code-compliance work. Screening a single candidate currently requires on the order of 80 hours of architect time — a binding constraint on how many candidates the market actually evaluates.
- Method
- An LLM reasoning over floor-plate geometry (from PLUTO and the NYC building-footprint layer), zoning text, egress rules in the NYC Building Code, and window-wall ratios derived from LL84 benchmarking. The model scores each candidate on convertibility — light-and-air, egress, plumbing-stack feasibility, zoning overlay — and emits a ranked short list with specific blockers for each building. A human architect re-enters the workflow for the short-list candidates.
- Data
pluto(858,644 parcel records), the NYC landmarks layer,dob_certificate_of_occupancy(73,855 rows for use-group history),ll84_monthly_energy(for occupancy and window-ratio proxies), and the NYC Zoning Resolution text.- Evidence
- NYU Furman Center, Gaining Ground: Options for Office-to-Residential Conversion in New York City (2023); NYC Department of City Planning, Office Adaptive Reuse Task Force report (2023). Both provide the convertibility-criteria framework that the LLM reproduces.
- Impact
- Cutting per-candidate screening cost from ~80 architect hours to ~30 minutes expands the candidate set screened per year from hundreds to the full 419-Msf pre-1991 office pool. That acceleration compresses the realization timeline of Report 01's Strategy E — office-to-residential conversion, a $3.8B/yr strategy at target adoption — by an estimated 12–18 months. The marginal cost of running the screener on all 180 Msf is under $1M in compute and engineering.
- Deployability
- Production-ready for candidate screening in 6 months; integration with DCP's own pipeline contingent on their adoption, 12–18 months.
AI-driven reclaimed-material marketplace
- Problem
- NYC operates three reclaimed-material warehouses (Big Reuse, Build It Green!NYC, and Lower East Side Ecology Center); Portland, Oregon — with a tenth of NYC's construction volume — operates fourteen (Build Reuse Directory, 2024). The binding constraint is not demand; it is discoverability. A brick, steel beam, or piece of millwork removed in a DOB DM filing is, in practice, invisible to the architect or contractor who would pay to reuse it. A physical warehouse cannot fix this; the asset needs a digital twin.
- Method
- A three-layer AI stack. Computer vision classifies and catalogs incoming reclaim from photos at intake. An LLM normalizes descriptions to a controlled vocabulary and emits structured listings. A demand-forecasting model cross-references upcoming DOB NB and A1 filings to surface likely matches. The output is a marketplace in which brokered reuse is possible at the speed of a web search.
- Data
- DOB DM filings on, NYC Business Integrity Commission C&D registrants, and the intake catalogs of Big Reuse, Build It Green!NYC, and the LES Ecology Center.
- Evidence
- Delta Institute, NYC Deconstruction Labor-Market Assessment (2022); Portland Build Reuse Directory (2024); academic literature on supply-demand matching in illiquid secondary markets. The underlying marketplace mechanics are not novel — the data substrate is.
- Impact
- At current DM volumes, NYC's reclaim-capture rate sits near 6 percent (Delta, 2022). A discoverability-led marketplace could realistically raise the rate to the Portland benchmark of ~30 percent over five years, implying recovered value of ~$60M/year at current DM volumes — expandable to ~$200M/year if reuse-forward procurement (Use Case 6) lifts the demand side. Carbon co-benefit: avoided embodied emissions from displaced virgin material.
- Deployability
- Pilot with one existing reuse warehouse in 9 months; citywide marketplace with private-warehouse participation in 24.
Embodied-carbon RFP-scoring agent for NYC DDC
- Problem
- NYC's Department of Design and Construction issues roughly $5 billion per year in capital-project RFPs. Report 01's Chapter 6 audit found that 0 of 38 sampled DDC RFPs referenced material reuse, and circularity scoring appeared in none of the standard templates. Public procurement is the lever with the highest leverage per dollar of policy effort — and the one currently least instrumented.
- Method
- An agentic LLM workflow: read the proposal PDF, extract declared material specifications, score against a circularity rubric (reused content, embodied-carbon budget, end-of-life plan, deconstruction-before-demolition clauses), and emit a standardized score and a structured critique. The scoring runs in under five minutes per proposal and produces the same score whether it runs today or in six months. Human procurement officers remain the decision-makers; the agent replaces narrative scanning, not judgment.
- Data
- The DDC RFP archive (public via DDC and the Procurement Policy Board); Carbon Leadership Forum, Whole Building Life-Cycle Assessment v2 (2023) benchmarks; and any agent-authored circular-procurement template adopted by the Mayor's Office of Contract Services.
- Evidence
- Stanford HAI research on LLM-over-procurement workflows (2023–2024); Carbon Leadership Forum WBLCA v2 (2023) for the embodied-carbon benchmarks; any published pilots of agentic procurement scoring in comparable municipal contexts. The core technique — structured-output LLM scoring against a rubric — is industrial-grade as of 2026.
- Impact
- At near-zero marginal cost per proposal, universal circularity scoring across the DDC pipeline redirects procurement toward reuse-capable suppliers. A conservative estimate: 6 percent of the $5B/yr flow redirected to circular suppliers over three years is ~$300M of cumulative reuse-market stimulus — structurally lifting the demand curve for Use Case 5, and giving NYC's reuse warehouses a credible procurement tailwind for the first time.
- Deployability
- Standalone scoring in 4 months; DDC template integration contingent on agency adoption, 12–24 months.
Cross-case summary
The six cases, ordered by deployability, mapped to their primary public-data substrate, the order-of-magnitude impact at NYC scale, the deployability window, and the Report 01 circular-economy strategy each supports.
| Use Case | Primary dataset | Impact | Deployability | Report 01 Strategy |
|---|---|---|---|---|
| 1. LL97 retrofit sequencing | ll84_monthly_energy | $12–20B capex avoided | 6mo / 18mo | Strategy B (Retrofit) |
| 2. FISP facade CV | dob_facades_compliance | ~$100M/yr cycle savings | 9mo / 24mo | Strategy C (Maintain) |
| 3. Material passports | dob_certificate_of_occupancy | $2–4B unlock (10yr) | 6mo / 24–36mo | Strategy D (Passports) |
| 4. Office-to-residential screener | pluto | Accelerates $3.8B/yr by 12–18mo | 6mo / 18mo | Strategy E (Convert) |
| 5. Reclaimed-material marketplace | DOB DM filings | $60–200M/yr recovered | 9mo / 24mo | Strategy F (Reuse) |
| 6. DDC RFP-scoring agent | DDC RFP archive | ~$300M redirected (3yr) | 4mo / 12–24mo | Public-capital lever (Ch. 6) |
Effort versus impact
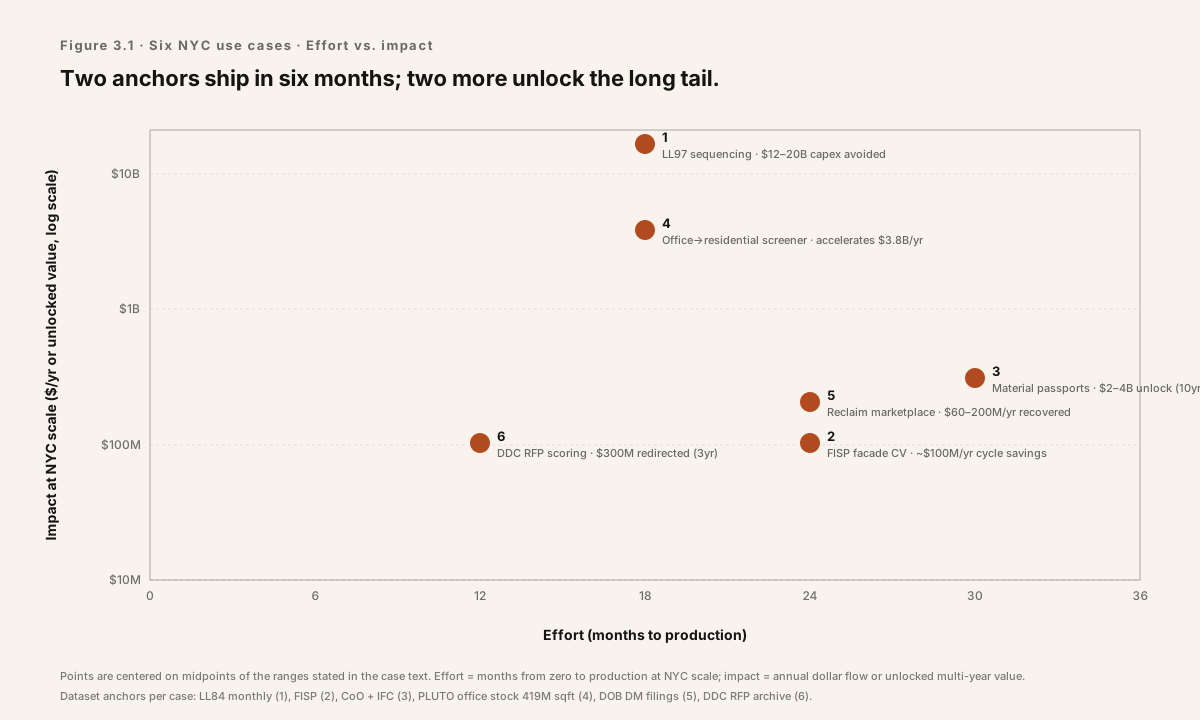
The six cases cluster into a clear pattern: two low-effort, high-impact cases (LL97 sequencing; office-to-residential screener) anchor the short-term build list; two medium-effort cases (FISP CV, DDC RFP scoring) produce immediate operational savings; two higher-effort cases (material passports, reuse marketplace) require coordinated regulatory or physical-market changes but unlock the largest long-run value.
Implications
1. The data already exists; the reasoning layer does not.
Each of the six use cases is bounded by a public dataset that is already published, already on the city's open-data platform, and — crucially — already used by the relevant regulatory process. The intelligence gap of Chapter 1 is not a data-collection gap; it is a reasoning-layer gap. The first-mover advantage goes to whoever builds the reasoning substrate, not to whoever builds another data-collection pipeline.
2. Public capital is the shortest path to scale.
Three of the six cases — LL97 sequencing on the public-authority portfolio, FISP inspection on public-owned buildings, and DDC RFP scoring — produce their impact through public procurement and public-owned stock. Report 01's Chapter 2 measured the public share of NYC construction at roughly fifteen percent by floor area but near-total by policy leverage. These are the cases where adoption does not require convincing thousands of independent owners; it requires convincing a handful of agencies.
3. Deployability is the binding constraint, not capability.
None of the six cases require a novel AI technique. Every one is an application of a well-documented method — portfolio optimization, computer-vision defect detection, LLM-based document extraction, agentic procurement scoring — to a well-documented dataset. The question is not whether the AI works. The question is whether the data, the agency relationships, and the user workflow can be assembled fast enough to matter. Chapter 4 turns to the global standards layer that governs the last of those.
How to cite
Edwards, J. (2026). Machine-Readable Buildings, Chapter 3 — Six New York Use Cases. Aedifice Research. Retrieved from https://aedifice-research.vercel.app/research/publications/machine-readable-buildings/chapter-3-nyc-use-cases.