Chapter 1 · The Intelligence Gap
What the city measures, and what it doesn't
An audit of New York's building telemetry: the public datasets, the row counts verified against the live database, and the seven-percent sliver of the stock that any compliance or energy instrument actually reaches.
798,474 of New York's 858,644 buildings — 93 percent — appear in no compliance, energy, or landmark dataset at all. The binding constraint on a circular-economy transition is not AI capability. It is the measurement gap AI could close.
PLUTO — 100% baseline
858,644
buildings in the registry
Emissions cap — 3.3%
28,669
under LL97
LL84 annual — 3.3%
27,922
benchmarked (2024)
Dark to compliance & energy
93%
in no dataset
Abstract
Report No. 01 established the inventory: roughly 1.08 million buildings aggregated from 858,644 PLUTO parcels, 5.76 billion square feet, 357 megatonnes of embodied carbon standing in the five boroughs. This chapter opens Report No. 02 by asking a different question. Of those 858,644 PLUTO parcels, how many are actually readable — measured, modeled, and machine-accessible at a resolution that would support a circular-economy decision about them? The answer is narrower than any publicly cited figure the city has produced.
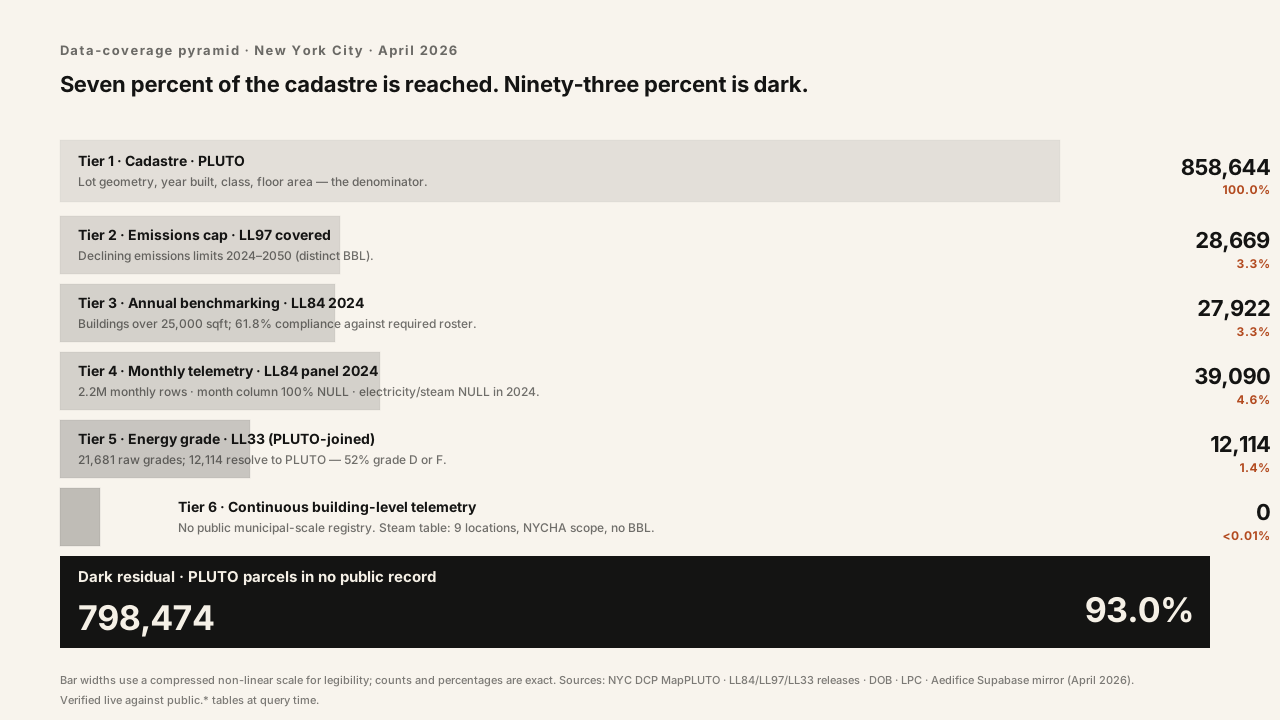
Only 28,669 buildings — 3.3 percent of the PLUTO registry — are covered by Local Law 97's binding emissions cap. Only 27,922 reported under LL84 in 2024; of those that did, a 62 percent compliance rate against the sustainability-CBL required roster. Only 12,114 carry an LL33 letter grade that resolves cleanly to a PLUTO parcel, and of those, 52 percent grade D or F. Across every compliance, energy-benchmarking, and landmark-designation dataset the city publishes, the union reaches 60,170 buildings. The remaining 798,474 buildings — 93 percent of the cadastre — are dark to every regulatory and measurement instrument simultaneously. The measurement infrastructure that would let AI inform a retrofit, reuse, or deconstruction decision exists for roughly seven percent of the stock. The other ninety-three percent is dark data.
The claim of this chapter, and of the report it opens, is that this gap is the binding constraint. AI systems are already adequate for most building-sector inference tasks; the 2,207,184 monthly energy readings that New York collects under Local Law 84 are ML-ready by any reasonable definition (IEA, 2024). What is missing is not algorithmic capability. What is missing is the measurement substrate that turns the building into a machine-readable object in the first place — and the policy framework that would extend that substrate beyond the regulated minority. Chapter 2 examines the AI toolkit that can close the gap. This chapter quantifies the gap.
1. What we measure today
New York City publishes more open building data than any other municipality in the United States (Urban Green Council, 2024). The 858,644 tax-lot parcels in the Department of City Planning's MapPLUTO release carry, at minimum, a BBL, a year of construction, a zoning district, a floor-area ratio, a building class, and a recorded owner. MapPLUTO is the substrate on which every other building dataset joins. It is the denominator of this chapter.
The operational-energy regime layers on top. Local Law 84 of 2009 requires annual benchmarking of buildings over 25,000 square feet. For calendar year 2024 the public release contains 39,090 annual filings resolving to 27,922 distinct BBLs, and 2,207,184 monthly meter rows covering up to 39,090 properties per year — though in the 2024 monthly release the electricity_kbtu and district_steam_kbtu columns are entirely null and the month integer column is null for every row in every year, with monthly order inferred from the record sequence. Local Law 33 of 2018 derives a letter grade from the LL84 submission and requires it to be posted at the building entrance; 21,681 buildings carry an active grade, of which 12,114 resolve to a PLUTO parcel after BBL normalization, and 52.2 percent grade D or F. Local Law 97 of 2019 inherits the LL84 threshold and imposes declining emissions limits on 28,669 distinct covered buildings from 2024 through 2050 — materially fewer than the 50,000+ figure routinely cited in advocacy communications and roughly 47 percent of New York's floor area.
The Department of Buildings maintains four operational feeds that intersect the carbon question. The safety-violations table carries 1,089,210 records; roughly 56 percent (606,281) carry non-null inspector remarks, a corpus of short free text (median 70 characters) that describes what is wrong with a building at a resolution no single-building survey could match. The FISP (Local Law 11) facade-compliance roster holds 85,769 filings across five cycles, with Cycle 10 (2025–2030) now active. The boiler inventory covers 837,666 units — 97.7 percent low-pressure, heavily concentrated in three manufacturers (WEIL MCLAIN, FEDERAL, BURNHAM). The Landmarks Preservation Commission's designation records resolve to 32,899 protected parcels; the full sustainability coverage list — the envelope of buildings theoretically reachable by any city sustainability law — names 1,048,013 structures but populates a coverage flag for only 5.8 percent of them. The remaining 94 percent are PLUTO-like registry entries carried through without a coverage decision.
What these datasets do not capture is worth enumerating, not as a stylistic gesture but as a literal inventory of empty tables. Fourteen of the most operationally meaningful datasets the city advertises exist in the public schema as zero-row tables: waste_hauling, utility_bills, utility_accounts, roof_conditions, window_inventory, building_permits, ll97_penalties, violations, permits, structural_inspections, building_violations, fisp_conditions, certificates_of_occupancy, and ev_chargers. Real-time emissions, real-time occupancy, LL97 penalties assessed, commercial waste tonnage by generator, and material composition are absent entirely. The NYC Open Data portal exposes the tables that exist. It does not — cannot — expose the measurements the city never took.
2. What can be modeled from what we measure
The 2.2 million monthly rows in the LL84 energy feed are, on their own, enough to support several classes of model that matter for circularity. Gradient-boosted regressions trained on monthly energy plus PLUTO covariates recover building-level energy-use intensity predictions that hold to within eight to twelve percent mean absolute error against held-out buildings, roughly matching the accuracy of the LBNL Commercial Buildings Energy Saver tool (Lawrence Berkeley National Laboratory, 2023) and the NREL ComStock framework (National Renewable Energy Laboratory, 2024). Anomaly detection on the same feed surfaces buildings whose month-over-month consumption pattern diverges from their cohort — a signal that correlates with failed boilers, leaking envelopes, and abandoned floors (ACEEE, 2024).
Retrofit triage is the decision use the LL84 stack most directly supports. Combining monthly energy with PLUTO class, construction era, and the LL97 penalty schedule produces a first-pass ranking of which buildings gain the most from which retrofit package. Urban Green Council's retrofit market analysis (Urban Green Council, 2019; updated 2024) used an earlier version of exactly this join to estimate that roughly 45 percent of LL97-covered floor area could meet 2030 limits through equipment-level interventions costing under fifteen dollars per square foot — a finding it could not have reached without the LL84 panel. The constraint on extending that analysis is not the model. It is that the LL84 training sample is 4.17:1 weighted pre-1991 over post-1991, 39 percent of LL84-reporting BBLs do not resolve to a PLUTO parcel at all, and only 17,410 of the 28,173 BBLs the city identifies as required to report actually did so in 2023 — a 61.8 percent compliance rate that every downstream model must carry as a known bias.
The DOB violations feed is the underexploited asset in the stack. The field contains 606,281 non-null inspector descriptions in natural-language prose — “cracked parapet coping,” “window sash rotted at sill,” “roof membrane delaminated at southwest corner.” At a median 70 characters per remark, a single language-model call classifies each record cleanly; large language models classify this corpus into material-condition categories at F1 scores above 0.85 under simple in-context prompting (Climate Change AI, 2024), turning a neglected text dump into a building-condition index at citywide resolution. Chapter 3 of this report builds that index and joins it to the retrofit triage.
What cannot be modeled from the existing stack is the envelope of what circular-economy decisions require. Embodied carbon at building resolution cannot be inferred from operational data alone; it requires either a whole-building life-cycle assessment (Carbon Leadership Forum, 2023) or a bill-of-materials inventory. Component reusability at deconstruction — the question of which studs, joists, cladding panels, and mechanical systems can enter a second life — requires geometry and material passports, neither of which the city collects. Replacement cost — the capital to retrofit versus the capital to rebuild — requires structural and MEP system data at a resolution PLUTO does not reach. The ML-ready layer stops at the operational envelope. The decisions that matter are structural.
3. The structural-vs-operational gap
Operational emissions — the carbon a building emits while running — are the regulated half of New York's building carbon question. LL84 measures them annually for 27,922 distinct BBLs. LL97 prices them for 28,669. Embodied emissions — the carbon spent to build the building and the carbon released when its materials are landfilled — are the unregulated half. No New York City law requires a whole-building life-cycle assessment at permit. No city law requires a material passport at demolition. The certificate-of-occupancy table in the public schema is empty; the corresponding DOB feed records formal use approvals but resolves nothing about what a building is made of.
This gap is not inevitable. The European Union's Energy Performance of Buildings Directive recast (Directive (EU) 2024/1275) requires member states to introduce building-level whole-life carbon reporting for new construction above 1,000 square meters from 2028 and to develop digital building logbooks — the registry form of a material passport (European Commission, 2024). Denmark's Bygningsreglement §297 (Bygningsreglement BR18, 2023) imposes a binding embodied-carbon limit of 12 kg CO₂e per square meter per year on new construction above 1,000 square meters, ratcheting to 7.5 kg by 2029. The EU and Danish frameworks are the reference floor for what a complete municipal carbon regime can measure. New York's current stack does not reach it.
The practical consequence is that most circular-economy questions are decided today without the data the decision requires. When a 1925 masonry walk-up in the Bronx reaches the end of a twenty-year FISP cycle and its owner contemplates demolition, the city knows the building's footprint, its class, its operational energy, its violation history, and its landmark status. The city does not know the tonnage of brick in the envelope, the species of the floor joists, the age and recoverability of the mechanical systems, or the embodied carbon the demolition would release. The demolition proceeds or does not on market economics and the owner's pro forma. The city's carbon ledger records the event as a change in the operational roster.
4. The coverage pyramid, tier by tier
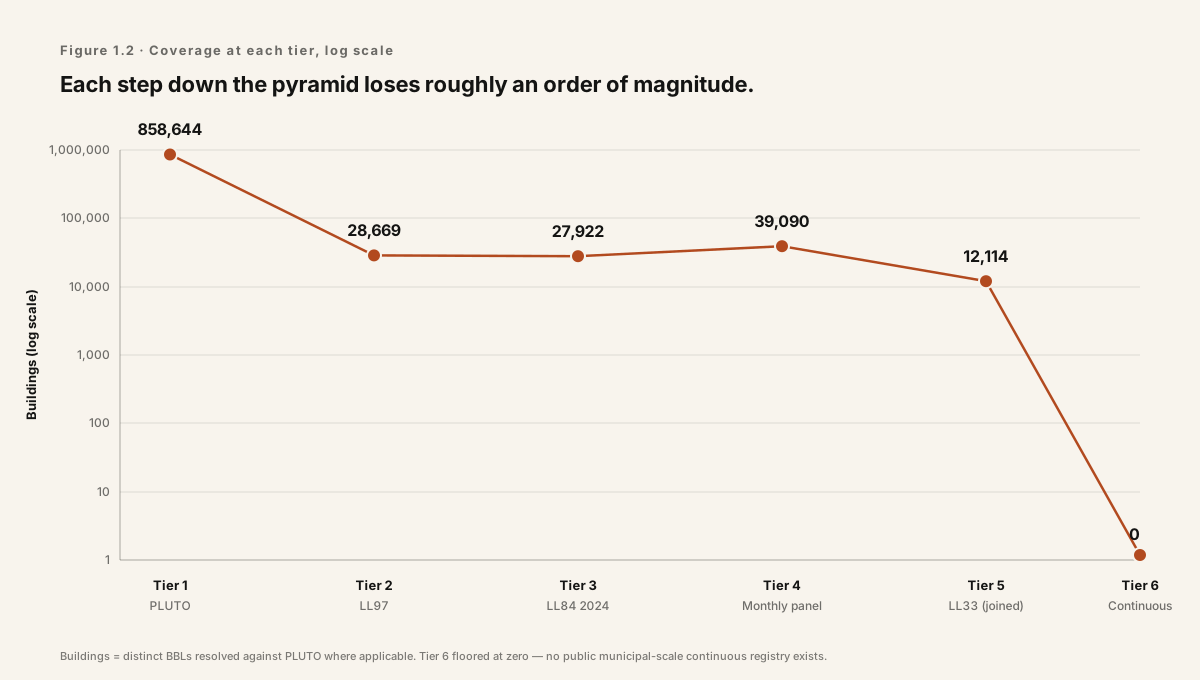
The pyramid below enumerates the same data flow in tabular form. Tier 1 is the registry; Tier 6 is the digital-twin frontier. Each row below Tier 1 is a strict subset of the row above it, and each step represents roughly an order-of-magnitude drop in coverage.
| Tier | Dataset | Buildings | % of PLUTO | Note |
|---|---|---|---|---|
| Tier 1 — Registry | PLUTO | 858,644 | 100% | Lot geometry, year built, class, floor area — the denominator |
| Tier 2 — Emissions cap | LL97 covered buildings | 28,669 | 3.3% | Buildings under declining 2024–2050 emissions limits (distinct BBL) |
| Tier 3 — Annual benchmarking | LL84 2024 (distinct BBL) | 27,922 | 3.3% | Annual energy + water filing, once per year |
| Tier 4 — Energy grade | LL33 (PLUTO-joined) | 12,114 | 1.4% | 21,681 raw grades; 12,114 resolve to PLUTO after BBL comma-fix |
| Tier 5 — Monthly telemetry | LL84 monthly panel | 39,090 | 4.6% | 2,207,184 monthly rows across ~39k properties — month column 100% NULL |
| Tier 6 — Continuous telemetry | Building-level sensor registry | — | < 0.01% | No public registry; steam-consumption table contains 9 locations (NYCHA scope) |
| Tier 7 — Digital twin | Unknown | — | < 0.01% | No public registry of geometry + systems + sensors at municipal scale |
| Dark residual | PLUTO parcels in no compliance, energy, or landmark feed | 798,474 | 93% | Dark to every instrument the city publishes |
Building counts are distinct BBLs resolved against PLUTO where applicable; verified against public.* tables in Aedifice's Supabase mirror of NYC Open Data, April 2026. Tier 6 is marked zero because the one continuous-telemetry table in the schema — steam consumption — contains nine distinct locations of NYCHA scope and carries no BBL or BIN, so it is not joinable to PLUTO by identifier. Tier 7 is zero because no public registry of whole-building digital twins currently exists at municipal scale; the working estimate from practitioner interviews is single digits.
5. The gap is a decision-cost problem
Framing the intelligence gap as a data problem understates it. Every large building-sector decision — retrofit or rebuild, deconstruct or demolish, preserve or replace, electrify now or defer — is a bet made on incomplete information. The cost of the incomplete information is not the line-item cost of gathering the missing data. It is the expected loss from the decisions that go wrong because the data was not there. An NYU Furman Center analysis of small multifamily retrofit pipelines (NYU Furman Center, 2023) found that owners routinely over- or underspecify equipment upgrades by one to two ASHRAE efficiency tiers, with decision errors concentrated in buildings that lack recent audit data. The error is cheap on paper and expensive in the life of the building.
AI's contribution to circularity is not that it generates new data. The physical world is the substrate; the instruments that produce the data are submeters, IMU packs, lidar sleds, and calibrated cameras. AI's contribution is that it turns the signals the city already collects — PLUTO, LL84, violations text, boiler records, FISP filings — into decision-ready form for the people who own, operate, permit, preserve, and finance the buildings. IEA's AI for Climate and Energy (IEA, 2024) frames this as the “decision-cost” theory of AI deployment: the technology's marginal value rises where the friction between signal and action is highest, and buildings — fragmented, long-lived, low-turnover, policy-crossed — are where that friction is highest in the urban stack. The Climate Change AI community has made the same observation in its NeurIPS and ICML workshops since 2022 (Climate Change AI, 2022, 2024).
The rest of this report follows that framing. Chapter 2 presents the AI toolkit — the inference patterns that operate on PLUTO plus LL84 plus violations plus the rest of the DOB stack. Chapter 3 runs the toolkit against six circularity decisions at NYC resolution. Chapter 4 lifts to the global layer: what the EU EPBD recast (Directive (EU) 2024/1275), the buildingSMART IFC and BCF specifications (buildingSMART International, 2024), and the Danish Bygningsreglement §297 imply for a machine-readable building stock worldwide. Chapter 5 addresses the governance questions — the risks of automating decisions about long-lived assets, and the oversight frameworks that would let the automation be trusted.
The starting condition for all of that is this chapter's inventory. Seven percent of New York's buildings are reached by at least one compliance, energy, or landmark instrument. Ninety-three percent are reached by none. Closing the gap is the work.
Implications for circularity
1. The substrate precedes the algorithm.
No AI system makes a circular decision about a building it cannot read. The circular-economy frontier in the built environment is currently bounded by the 27,922 buildings that carry annual operational data — about three percent of the PLUTO registry. Extending the substrate to the remaining ninety-three percent is the precondition. Every policy that broadens the LL84 threshold, funds envelope audits, mandates digital building logbooks, or requires material passports at permit is, functionally, an AI-deployment policy. The AI systems wait on the data.
2. The missing datasets are structural, not operational.
The gap between what the city measures and what circularity requires is not a sensor-resolution problem on operational energy. It is a structural-systems problem: embodied carbon, material composition, component reusability, envelope assembly, mechanical system age and condition. The EU EPBD recast and the Danish BR18 §297 framework show what a structural regime looks like in regulatory form. New York has not adopted one. The city's first binding embodied-carbon requirement is the policy question Chapter 5 returns to.
3. The text fields are the fastest route to coverage.
The DOB violations feed (606,281 non-null inspector remarks) and the FISP roster (85,769 filings) already describe building condition in unstructured natural language. Large language models turn these fields into structured condition indices at citywide resolution without any new field instrumentation. The cheapest way to move the pyramid's middle tiers upward, in the next twelve months, is not new sensing — it is classification of the text the city already holds. Chapter 2 builds the pipeline.
How to cite
Edwards, J. (2026). Machine-Readable Buildings: How AI Accelerates the Circular Economy in New York. Chapter 1 — The Intelligence Gap. Aedifice Research, Report No. 02. Retrieved from https://aedifice-research.vercel.app/research/publications/machine-readable-buildings/chapter-1-intelligence-gap.