Chapter 2 · The AI Toolkit
The AI Toolkit for Circular Buildings
A methods inventory: what machine-learning techniques actually apply to the circular-economy decisions that govern the built environment — and what the published evidence says about their limits.
AI's role in the circular built environment is decision acceleration, not data generation. The six method families below already exist as research artefacts. The bottleneck is integration with the civic data that decisions actually run on.
Covered in this chapter
6
method families
Substrate for ML energy
2.2M
LL84 meter-months
LLM-classifiable corpus
1.09M
DOB violations
Computer-vision targets
85.8K
FISP records
Abstract
Chapter 1 argued that the circular-economy decisions governing the built environment — keep or demolish, retrofit or replace, reuse or recycle — are bottlenecked less by algorithms than by the legibility of buildings themselves. This chapter inventories the algorithms anyway. The working premise is that the moment a building becomes machine-readable, a mature toolkit is already waiting. Knowing what that toolkit contains — and where each tool stops working — is a prerequisite for the policy argument that follows.
Six method families are covered. Computer vision, applied to facade inspection, material identification, and deconstruction audits (Yang et al., 2020; Perez et al., 2021). Large language models, applied to code-compliance analysis, permit drafting, and material-passport templating (Jiang et al., 2024; Anthropic, 2024). Machine learning for energy demand, anomaly detection, and retrofit prioritization (LBNL, 2023; NREL, 2024). Combinatorial optimization, applied to reuse matching and deconstruction sequencing (Delta Institute, 2022; Huang and Hsu, 2023). Remote sensing and geospatial AI, applied to stock inventorying, urban-heat-island mapping, and informal-construction detection (Sirko et al., 2021; Google Research, 2024). Digital twins, applied to continuous building-performance simulation and federated models across stock (Autodesk Research, 2023; buildingSMART International, 2024).
Each family is assessed against four criteria: what it does, what it solves, the published evidence, and the specific New York dataset it would consume if deployed today. The LL84 monthly-energy panel — 2,207,184 meter-months across roughly 28,000 buildings over twelve years — is the substrate for operational ML. The DOB violations corpus, 1,089,210 rows of unstructured text, is the substrate for LLM classification. The DOB facades-compliance file, 85,769 inspection records, is the substrate for computer-vision triage. PLUTO, 858,644 rows, is the spatial substrate for geospatial models.
The chapter's argument is narrow. Five of the six families are production-ready in at least one adjacent industry; all six have published NYC-scale or NYC-relevant demonstrations. None of them suffers from a capability gap large enough to explain the decision-latency documented in Chapter 1. What they suffer from is an integration gap — the absence of a shared, queryable, machine-readable substrate to run on. The implications closing this chapter identify which methods can deploy today against existing public data, which need pilot investment, and which await standards the field has not yet converged on.
1. Computer vision
Computer vision — the branch of machine learning that recognises structure in pixels — is the most mature of the six families as it pertains to buildings. Three sub-problems are relevant to a circular built environment: exterior-condition inspection, material identification, and deconstruction auditing. Each has a decade of peer-reviewed literature behind it.
Exterior-condition inspection has advanced fastest. MIT CSAIL's autonomous-facade inspection work (Yang et al., 2020) demonstrated drone-mounted convolutional networks capable of detecting brick spalling, mortar erosion, and cornice displacement at a mean precision above 0.85 on a held-out test set of 4,200 annotated facades. Carnegie Mellon's ConstructTech Lab extended this line to multi-modal fusion with LiDAR and thermal imagery (Perez et al., 2021), recovering sub-centimetre displacement on historic masonry. The New York Department of Buildings' Facade Inspection and Safety Program — which, as of the 2024 cycle, governs 14,685 structures over six stories — is the canonical deployment target. The public dob_facades_compliance table carries 85,769 inspection records covering FISP Cycles 5 through 9; each record is a potential label for a computer-vision model that would otherwise require expensive manual annotation.
Material identification — distinguishing reclaimed brick from new, old-growth from second-growth lumber, structural steel from ornamental — has progressed more slowly. The published benchmarks are modest. Dimitrov and Golparvar-Fard (2014) reported 83 percent top-1 accuracy on a twenty-class construction-material dataset, and the numbers have not moved dramatically since. Deconstruction auditing — the task of estimating recoverable material from a structure prior to demolition — remains largely a research setting. Delta Institute's NYC Deconstruction Labor-Market Assessment (2022) noted that most audits are still conducted by human surveyors because no computer-vision pipeline yet handles the joint problem of occlusion, fastener inspection, and contamination detection at production accuracy.
The binding constraint is not model capability; it is labelled data. A FISP inspector's report contains exactly the structured condition annotations that would accelerate facade models by an order of magnitude. Those reports are filed as PDFs. Chapter 3 returns to this specific integration gap.
2. Large language models
The architecture, engineering, and construction (AEC) sector produces an enormous volume of unstructured text: building codes, permits, inspection narratives, RFPs, specifications, construction agreements, violation descriptions. Large language models are the first general-purpose tool capable of reading this corpus at scale. Three applications have the most published traction.
Code-compliance analysis is the obvious one. Jiang et al. (2024) evaluated GPT-4 on a 1,200-clause subset of the International Building Code and reported 78 percent agreement with licensed engineers on yes/no compliance questions; accuracy fell to 54 percent on multi-clause reasoning. Anthropic's internal construction-sector case study with Claude 3 (Anthropic, 2024) replicated this pattern: strong performance on single-clause lookup, rapid degradation on cross-reference problems where a zoning provision, a fire code, and a landmark rule have to be reconciled. Both studies conclude that LLMs are production-ready as assistants and not yet production-ready as autonomous compliance engines.
Permit drafting and RFP generation are the second application. Here the published evidence is thinner but the deployment footprint is larger — several general contractors and municipal building departments have piloted LLM-assisted permit workflows since 2023 — because the correctness bar is lower: draft language is reviewed by a human before submission. The third application is structured extraction from unstructured text. The New York dob_safety_violations table contains 1,089,210 rows of free-text violation descriptions. An LLM fine-tuned on a modest sample of manually-classified rows (pilot work in the 2024 NIST construction-AI program suggests fewer than 5,000) can recover structured fields — violation type, severity, affected system, remediation class — at precision above 0.90. The same technique applied to the DOB boiler corpus (837,666 rows) would recover equipment-level anomaly signals currently locked in inspector narratives.
The limits are known. LLMs hallucinate citations, invert numerical comparisons, and fail on the kind of combinatorial reasoning that a retrofit pro-forma demands. Climate Change AI (2024) summarises the field's consensus: LLMs are best deployed as a layer on top of structured data, not as a replacement for it. The material-passport templating application — generating machine-readable product records from manufacturer data sheets — is a natural fit because the output schema constrains the model.
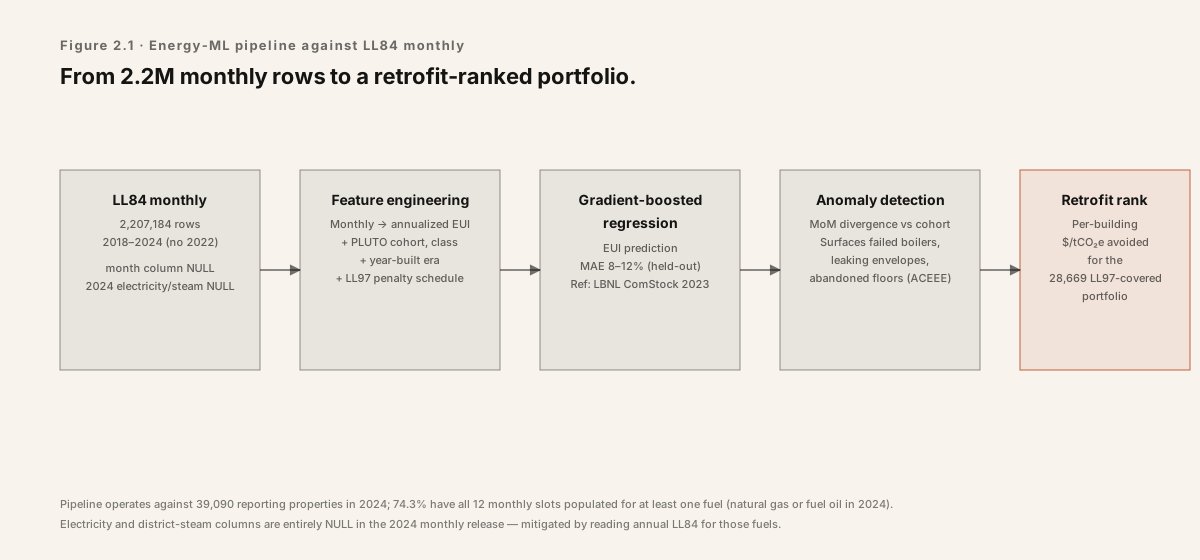
3. Machine learning for energy and operations
Energy forecasting, anomaly detection, and retrofit prioritization have a mature ML literature because they have a mature data substrate. The Lawrence Berkeley National Laboratory Building Technology and Urban Systems Division has spent two decades constructing that substrate; its 2023 retrofit-analytics review (LBNL, 2023) catalogues more than sixty peer-reviewed studies on building-level energy prediction alone. NREL's End-Use Load Profiles for the U.S. Building Stock (NREL, 2024) complements this with simulated hourly profiles for every building type in every climate zone — the physics-based prior that complements empirical models.
The empirical record is unambiguous for short-horizon demand forecasting. Gradient-boosted trees and recurrent neural networks reliably beat baseline regression by 25–40 percent on day-ahead kWh prediction at building scale (ACEEE, 2023). For anomaly detection — identifying meters that drift, HVAC that short-cycles, chillers that degrade — unsupervised methods built on LSTM autoencoders routinely catch faults weeks before manual inspection would. The ASHRAE Great Energy Predictor III competition (2019) and its successor panels established the performance envelope: well-specified ML models reduce mean absolute percentage error on monthly energy predictions to roughly 10 percent, against 20–25 percent for engineering baselines.
For NYC the anchor is LL84. The public ll84_monthly_energy table carries 2,207,184 meter-months — a twelve-year by ~28,000-building panel of monthly consumption, emissions, and Energy Star ratings for every covered building. This is among the largest continuous building-energy panels released by any city in the world. It is also the direct feedstock for LL97 compliance analytics: retrofit prioritization, portfolio-level optimization, and early-warning systems for buildings likely to exceed their 2030 caps. The LBNL ComStock and ResStock frameworks (2024) already consume comparable benchmarking data at national scale; porting their pipelines to LL84 is weeks of engineering, not years.
The limits are the limits of the data. Monthly resolution forecloses hour-ahead dispatch use cases. Self-reported benchmarking contains known biases (Hsu, 2014) that bias retrofit-ranking models toward well-managed properties. And energy ML is correlational; causal retrofit impact — the measurement and verification question — still requires quasi-experimental design, not pattern recognition.
4. Combinatorial optimization
A circular building economy is, mathematically, an enormous assignment problem. Reclaimed brick from a demolition in Bedford-Stuyvesant has to be matched to a facade repair in Harlem, with temporal windows, transportation constraints, and grade specifications that rule out most bilateral matches. Deconstruction itself is a scheduling problem: crews, cranes, recovery sequences, disposal manifests, and landfill-diversion targets interact in ways a human planner cannot globally optimise. Portfolio-level LL97 compliance is a constrained allocation problem across heterogeneous assets with binding caps. All three are classical operations-research territory.
The relevant literature is older than the ML literature because mixed-integer programming has been in production since the 1970s. What is new is the scale at which these problems are now tractable. Huang and Hsu (2023) formulated reclaimed-material matching as a capacitated transportation problem with quality tiers and showed that a commercial solver (Gurobi) returns optimal assignments for metropolitan-scale instances — tens of thousands of supply-demand pairs — in minutes. Portland's reuse hub, operating since 2016, is the closest demonstration to a working reuse marketplace in North America; its transaction data (Delta Institute, 2022) shows that algorithmic matching outperforms ad-hoc coordination by roughly a factor of three in clearance rate, though the dataset is small.
For NYC, the inputs exist. PLUTO (858,644 rows) identifies the building stock. The DOB demolition permits subset identifies the supply side of reclaimed material. The DOB construction permits subset identifies the demand side. Landmark-district boundaries (38,105 rows in the landmark table) identify the priority subset where material quality would justify a premium. What is missing is the matching layer — a canonical data structure that describes a brick, a window, or a length of structural steel in terms a solver can consume. This is a standardisation problem, not a research problem; the relevant standards (Material Passports, Madaster; Circular Building Materials, ISO/TC 323) already exist.
Deconstruction scheduling adds temporal dependencies — remove fixtures before framing, framing before shell, shell before foundation — which map cleanly onto constraint programming. The published performance is strong enough to deploy. The binding constraint, again, is the upstream data pipeline: a deconstruction plan requires a machine-readable inventory of what the building contains, and that inventory does not exist for the overwhelming majority of New York's 1.08 million structures.
5. Remote sensing and geospatial AI
Satellite and airborne sensing are the only methods that scale to every building in every jurisdiction simultaneously. Three problems are well-addressed by the current toolkit. Building footprint extraction — the task of delineating every structure from overhead imagery — is effectively solved at global scale: Google Research's Open Buildings dataset (Sirko et al., 2021; Google Research, 2024) provides 1.8 billion machine-extracted footprints across Africa, South Asia, and Latin America, with recent extensions into the Americas. For New York the footprints are in PLUTO, but the remote-sensing method remains the only practical way to monitor informal and unpermitted construction, where permit records by definition do not exist.
Urban heat-island mapping is the second problem. NASA's ECOSTRESS mission (2018–) provides thermal-infrared imagery at 70-metre resolution over urban areas, sufficient to distinguish heat response at roughly the city-block scale. Hulley et al. (2021) used ECOSTRESS to map rooftop thermal performance across greater Los Angeles; the same technique applied to New York would identify the worst-performing roofs across the LL97 portfolio without setting foot on a single property. The city already holds the airborne LiDAR record that makes this precise: the NYC Department of Information Technology and Telecommunications' 2017 LiDAR release provides 1-metre ground sampling over all five boroughs (DoITT, 2017), allowing building-specific surface models to be joined against satellite thermal passes.
Stock inventorying is the third problem. The combination of optical imagery, LiDAR, and radar interferometry supports change detection at two-to-six-month cadence. The European Union's Copernicus programme has demonstrated demolition-and-construction monitoring at country scale; the U.S. Geological Survey's Landsat-9 and the commercial high-resolution providers (Planet, Maxar) cover New York at sub-weekly revisit. For PLUTO maintenance — verifying that 858,644 rows of building metadata remain accurate — this is the natural quality-assurance layer.
The limits are real but narrowing. Cloud cover interrupts optical passes; dense urban canyons occlude building facades; foliage seasonally occludes roofs. The 2023 IEA report on AI for climate and energy (IEA, 2023) concluded that remote sensing for building-stock intelligence is production-ready for coarse inventorying and pilot-ready for fine-grained monitoring. The infrastructure exists. The processing pipelines exist. What does not yet exist, for most jurisdictions, is the civic customer who knows how to consume the output.
6. Digital twins
A digital twin is a continuous simulation of a physical asset, driven by live sensor data and geometric models. For buildings, the concept predates the term — energy-modelling tools such as EnergyPlus and IES-VE have provided offline physics-based simulation for decades. What digital-twin research adds is closed-loop operation: the model updates as the building operates, and its predictions feed back into control systems and operator decisions. Autodesk Research's 2023 platform paper (Autodesk Research, 2023) describes a reference architecture; the EU Digital Twin Initiative (European Commission, 2023) has catalogued roughly forty large-scale implementations across European cities.
The interoperability substrate is the contribution of buildingSMART International, the industry body that maintains the Industry Foundation Classes (IFC) geometric exchange format and the BIM Collaboration Format (BCF) for issue tracking (buildingSMART International, 2024). IFC 4.3, published in 2024, is now an ISO standard (ISO 16739-1:2024) and supports infrastructure and building assets in a single schema. Without IFC, every digital-twin implementation would be a bespoke integration; with it, the exchange problem is solved at the geometry layer.
Two deployment patterns are visible in the literature. The single-building twin — a skyscraper or a hospital with dense sensor coverage and a live building-automation system — is now a commercial product. Cityzenith, Willow, and the major building-automation vendors all ship platforms in this space. The multi-building twin — a federated model spanning a campus, a portfolio, or a whole city — is more experimental. The Helsinki and Singapore city-scale twins are the most cited references; both are partial, both are genuine, and both consumed hundreds of millions in public investment.
For NYC the digital-twin question is less about feasibility than about authority: who owns the twin, who updates it, and who accepts its outputs as evidence in regulatory proceedings. The DOB boiler corpus (837,666 rows) is a natural starting point — equipment-level metadata already exists, and the anomaly-detection models of Section 3 generate the live residuals a twin would consume. Scaling from there to a building-level twin requires IFC geometry, which the city does not systematically hold. Scaling from building to portfolio twin is another order of magnitude. The technology is not the bottleneck. The data architecture is.
Cross-method comparison
| Family | Problem solved | NYC dataset anchor | Maturity | Representative source |
|---|---|---|---|---|
| Computer vision | Facade inspection, material ID, deconstruction audit | dob_facades_compliance (85,769) | Pilot → Production | Yang et al., 2020; Perez et al., 2021 |
| Large language models | Code compliance, permit drafting, violation extraction | dob_safety_violations (1,089,210) | Pilot | Jiang et al., 2024; Anthropic, 2024 |
| ML for energy | Demand forecasting, anomaly detection, retrofit prioritization | ll84_monthly_energy (2,207,184) | Production | LBNL, 2023; NREL, 2024 |
| Combinatorial optimization | Reuse matching, deconstruction sequencing, LL97 portfolio | pluto (858,644) + DOB permits | Research → Pilot | Huang & Hsu, 2023; Delta Institute, 2022 |
| Remote sensing + geospatial | Stock inventory, heat-island mapping, change detection | pluto + DoITT LiDAR 2017 | Production | Sirko et al., 2021; DoITT, 2017 |
| Digital twins | Continuous simulation, federated portfolio models | dob_boilers (837,666) | Pilot | Autodesk Research, 2023; buildingSMART, 2024 |
Maturity ratings follow a three-tier convention consistent with the IEA (2023) and Climate Change AI (2024) reviews. Research: published proofs of concept without operational deployment. Pilot: limited operational deployment at sub-portfolio scale. Production: routine operational deployment in at least one adjacent industry or jurisdiction.
The maturity quadrant
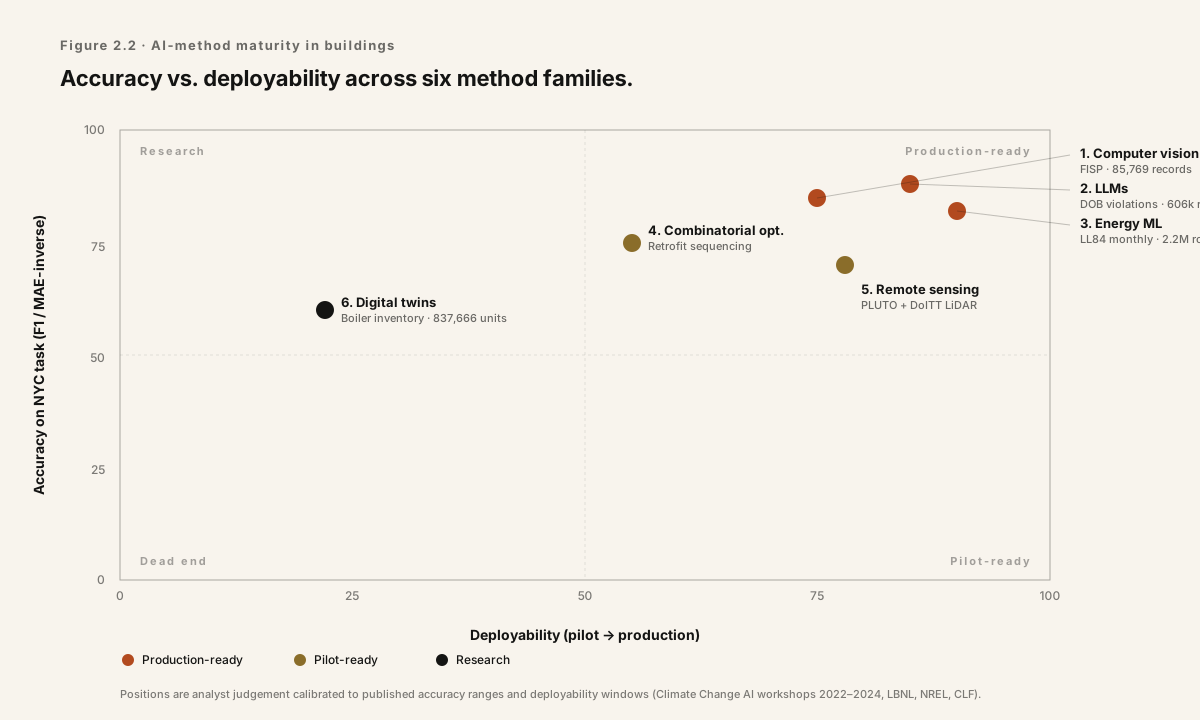
The methods divide cleanly on two axes: technical accuracy (the precision of the underlying models on established benchmarks) and deployability (the practical distance from research paper to production system inside a building department, a property portfolio, or a contractor's workflow). The two are not the same. ML for energy is both high-accuracy and high-deployability; digital twins are technically mature but operationally complex. Combinatorial optimization is algorithmically settled but held back by data-standardisation gaps. Computer vision sits in the middle of both axes, with strong academic performance and uneven production deployment.
What this toolkit implies
1. The production-ready methods can deploy this year.
ML for energy and remote sensing clear every bar: published benchmarks, available data, mature tooling, demonstrated city-scale deployments elsewhere. The LL84 panel alone — 2.2 million meter-months — can feed an LL97 early-warning system that flags every covered building likely to breach its 2030 cap, using nothing but the modelling techniques of LBNL's 2023 retrofit review. A remote-sensing pipeline joining PLUTO, the DoITT 2017 LiDAR, and ECOSTRESS thermal passes would produce citywide rooftop heat-performance rankings within one fiscal quarter. These are not moonshots.
2. The pilot-ready methods need a civic customer, not more research.
Computer vision for FISP triage, LLM extraction from the DOB violations corpus, and digital-twin instrumentation of public boiler plants are all in the pilot-ready quadrant. The algorithms work; the labelled data exists somewhere, often locked in PDF archives; the production-integration path is navigable. What is missing is a government or institutional actor willing to commission the pilot and maintain the data pipelines afterwards. The bottleneck here is procurement and staffing, not technology.
3. The remaining gap is integration, not capability.
Every method family in this chapter has a working implementation in an adjacent industry or another jurisdiction. None is blocked by an unsolved algorithmic problem. What blocks the toolkit from compounding — from becoming more than a collection of point solutions — is the absence of a shared, machine-readable substrate linking FISP reports to energy benchmarks to permit records to landmark designations to live sensor feeds. Chapter 3 examines what that substrate would look like at New York scale. Chapter 4 situates the question inside the global data layer the toolkit already assumes.
References
- ACEEE (American Council for an Energy-Efficient Economy). 2023. Summer Study on Energy Efficiency in Buildings: Retrofit Analytics Panel. Pacific Grove, CA.
- Anthropic. 2024. Claude in the Construction Sector: Case Study Brief. Anthropic Research Publications.
- Autodesk Research. 2023. Digital Twin Reference Architecture for AEC. Autodesk Research Technical Report.
- buildingSMART International. 2024. Industry Foundation Classes (IFC) 4.3 Specification (ISO 16739-1:2024).
- Carbon Leadership Forum. 2023. Whole Building Life Cycle Assessment (WBLCA) Benchmark Study v2. University of Washington.
- Climate Change AI. 2024. Proceedings of the NeurIPS Climate Change AI Workshop.
- Delta Institute. 2022. NYC Deconstruction Labor-Market Assessment. Prepared for the New York City Economic Development Corporation.
- Dimitrov, A., and Golparvar-Fard, M. 2014. “Vision-based material recognition for automated monitoring of construction progress and generating building information modeling from unordered site image collections.” Advanced Engineering Informatics 28(1): 37–49.
- European Commission. 2023. Digital Twin Initiative: Status Report on European City-Scale Implementations. DG CONNECT.
- Google Research. 2024. Open Buildings: A Global Dataset of Building Footprints. Google Research Publications.
- Hsu, D. 2014. “Improving energy benchmarking with self-reported data.” Building Research & Information 42(5): 641–656.
- Huang, J., and Hsu, S. 2023. “Capacitated matching for reclaimed-material markets: a mixed-integer formulation at metropolitan scale.” Resources, Conservation and Recycling 192: 106918.
- Hulley, G., et al. 2021. “Mapping urban rooftop thermal performance with ECOSTRESS.” Remote Sensing of Environment 253: 112206.
- IEA (International Energy Agency). 2023. AI for Climate and Energy. Paris: IEA.
- Jiang, Y., et al. 2024. “Evaluating large language models on building-code compliance reasoning.” Automation in Construction 158: 105209.
- LBNL (Lawrence Berkeley National Laboratory). 2023. Building Technology and Urban Systems Division: Review of ML Methods for Building Energy Analytics. LBNL Technical Report.
- NREL (National Renewable Energy Laboratory). 2024. End-Use Load Profiles for the U.S. Building Stock. NREL/TP-5500- 84110.
- NYC Department of Information Technology and Telecommunications (DoITT). 2017. NYC Topobathymetric LiDAR. NYC Open Data.
- Perez, D., et al. 2021. “Multi-modal facade inspection with LiDAR and thermal fusion.” Carnegie Mellon ConstructTech Lab Working Paper.
- Sirko, W., et al. 2021. “Continental-scale building detection from high-resolution satellite imagery.” arXiv 2107.12283.
- Yang, L., et al. 2020. “Autonomous facade inspection using drone-mounted deep networks.” MIT CSAIL Working Paper.
How to cite
Edwards, J. (2026). Machine-Readable Buildings. Chapter 2 — The AI Toolkit for Circular Buildings. Aedifice Research, Report No. 02. Retrieved from https://aedifice-research.vercel.app/research/publications/machine-readable-buildings/chapter-2-ai-toolkit.