The NYC Façade
Compliance Atlas
A 2026 snapshot of Local Law 11 risk across 16,858 buildings.
The five-year FISP cycle is not functioning as a maintenance regime; it is functioning as a delayed-penalty enforcement mechanism. Two-thirds of buildings failed first-submission. Cycle 10 is 50% behind pace.
FISP universe
16,858
buildings
First submission
67.1%
Cycle 9 rejection
Sidewalk sheds
9,054
active citywide
Open exposure
$509M
across 272,010 ECB
Abstract
New York City requires every building taller than six stories to have its façade physically inspected by a licensed engineer or architect every five years. The program — the Façade Inspection Safety Program (FISP) — was established by Local Law 11 of 1998 and codified in Title 1, Rule 103-04 of the Rules of the City of New York. 16,858 buildings are currently subject to it.
We present a complete public-data audit of the most recent completed cycle (Cycle 9, 2020–2024) and the early enrollment of Cycle 10 (2025–2030, in progress). All figures derive from live NYC Open Data feeds refreshed within 24 hours of publication. Six independent hypotheses are formulated, tested, and reported with explicit methodology. The analysis is, to our knowledge, the first openly published and fully reproducible study of all completed FISP cycles plus the in-flight Cycle 10.
Two penalty figures are reported and never conflated: theoretical-maximum accrued exposure (computed from filing-history dataset fields and reported per cycle) and authoritative current liability (computed from the live OATH unpaid-balance field, the only live billing ledger in the public corpus). Per-building current-due figures are not extrapolated from the dataset; they are retrievable only from the city's live penalties portal.
Six findings
1. Two-thirds of Cycle 9 buildings required iterative re-filing.
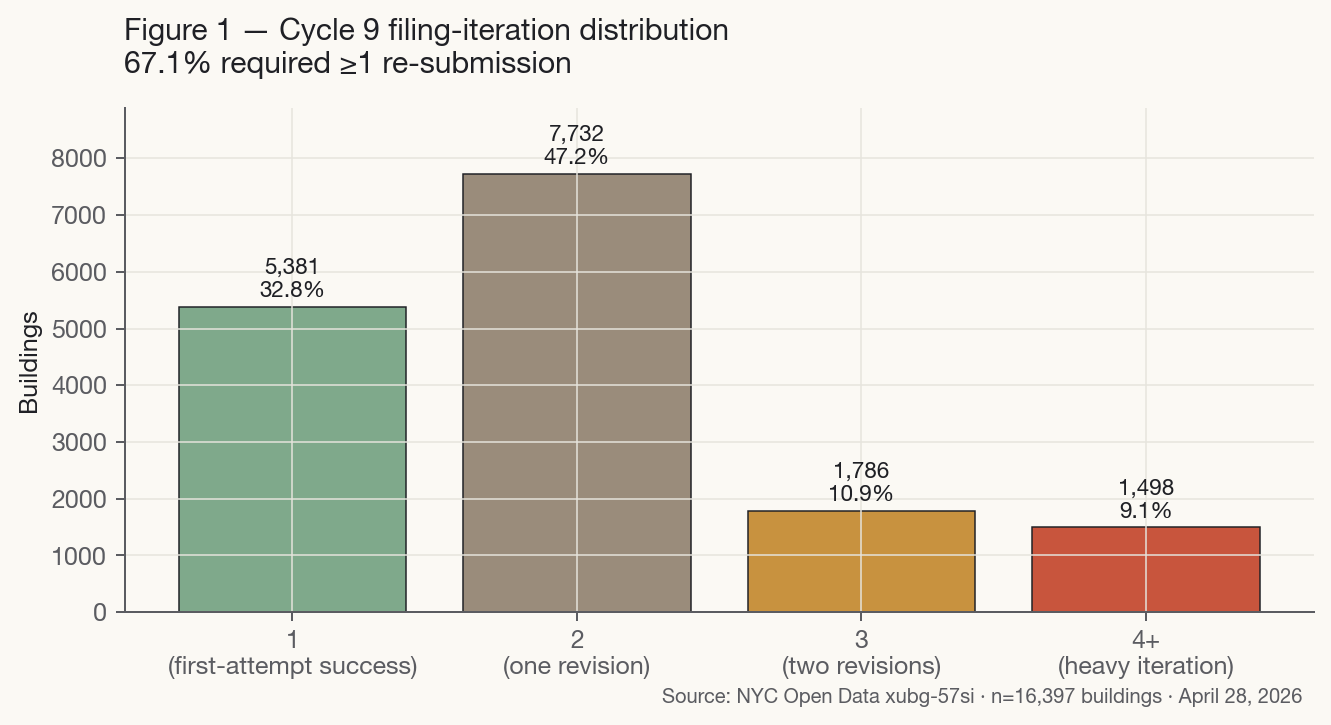
Of the 16,397 buildings that engaged with Cycle 9, 67.1% required at least one re-submission. 19.8% required three or more. 9.1% required four or more. At an industry estimate of $3,000–$8,000 per professional rework cycle, the aggregate Cycle 9 rework cost falls between $33M and $88M — paid by NYC building owners as professional fees with no compliance benefit.
2. 11,719 buildings did not file at all in Cycle 9.
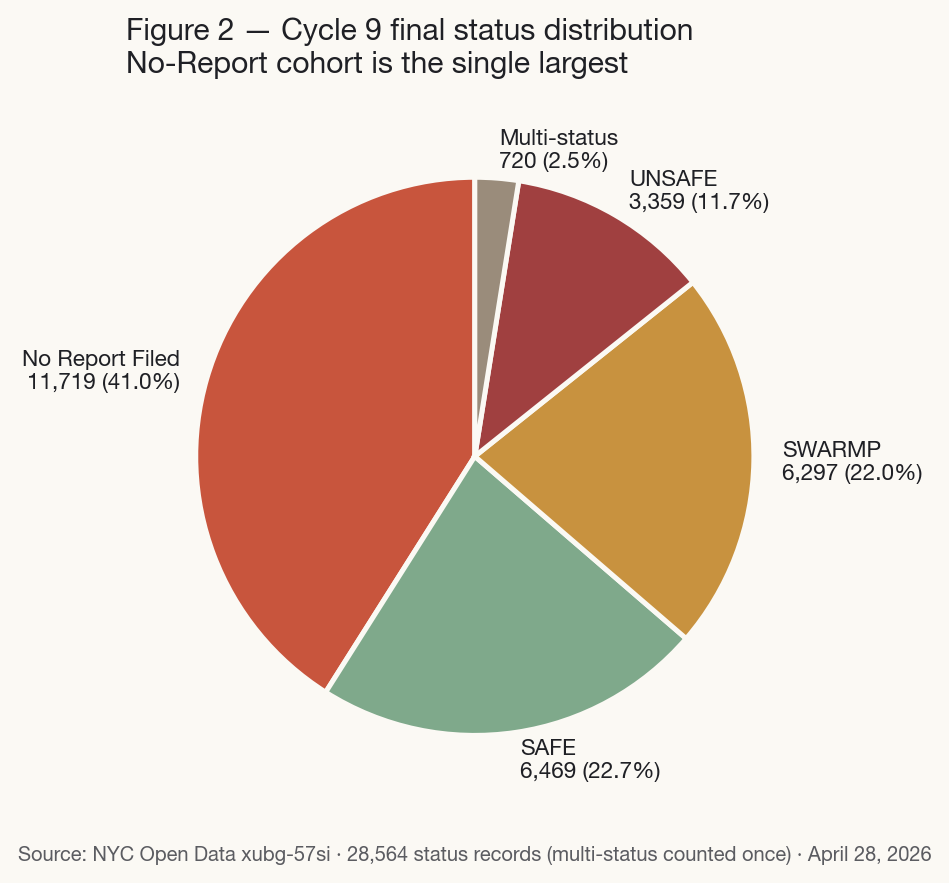
The “No Report Filed” cohort is the single largest of all Cycle 9 status classes — larger than SAFE, SWARMP, or UNSAFE individually. Each building accrues the $5,000/year failure-to-file penalty plus $1,000/month from sub-cycle window close. At a conservative $17,000/year/building, this cohort generates ~$200M in annual penalty accrual with no remediation outcome.
3. Sidewalk shed cohorts cluster in the highest-penalty bands.
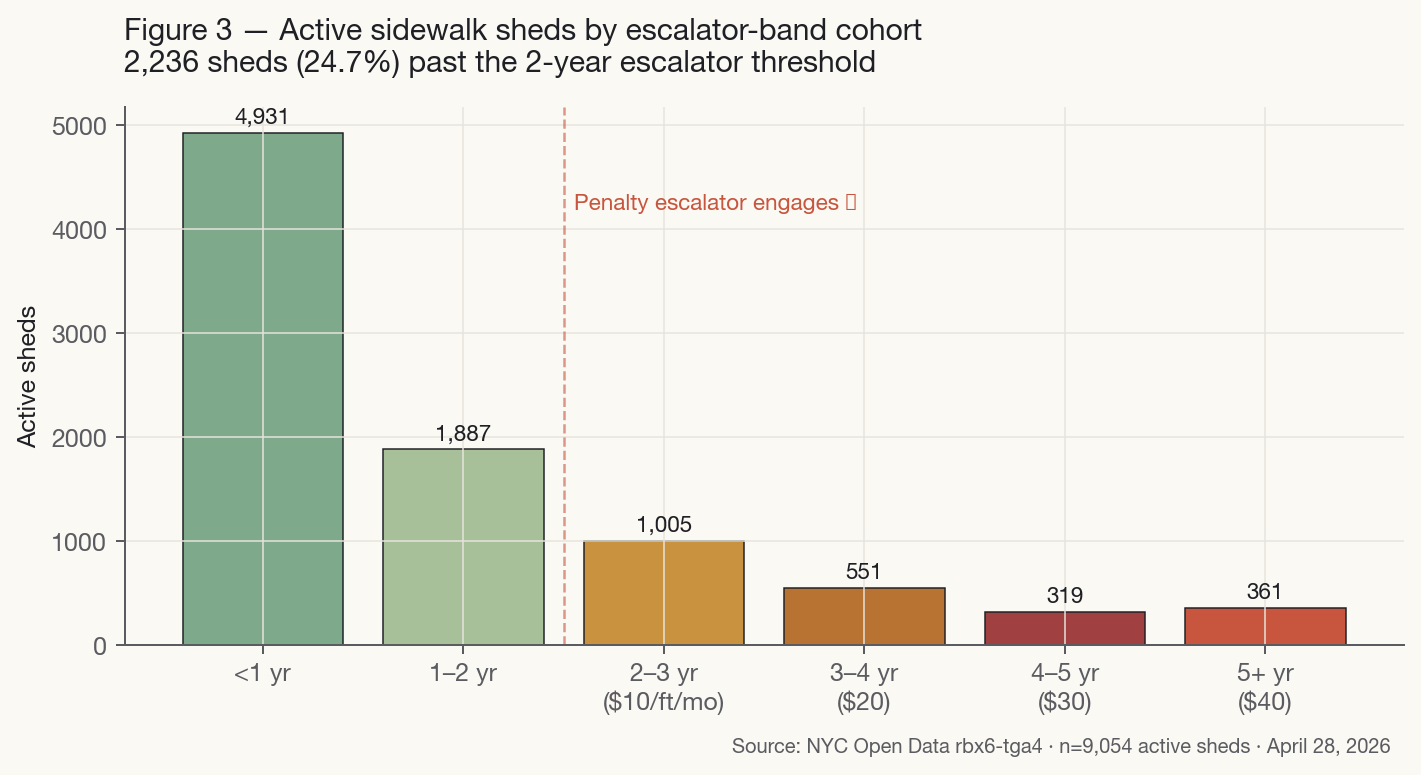
9,054 sidewalk sheds are active in NYC today. 2,236 (24.7%) have stood more than two years — the threshold at which Rule 103-04(d)(3) engages a per-foot, per-month penalty escalator that peaks at $40 per linear foot per month at Year 5. 361 sheds sit in that maximum band today. The combined penalty + rental burden on the >5-year cohort is approximately $30M–$50M/year, paid primarily by 361 building owners.
4. Cycle 10 enrollment is severely lagging.
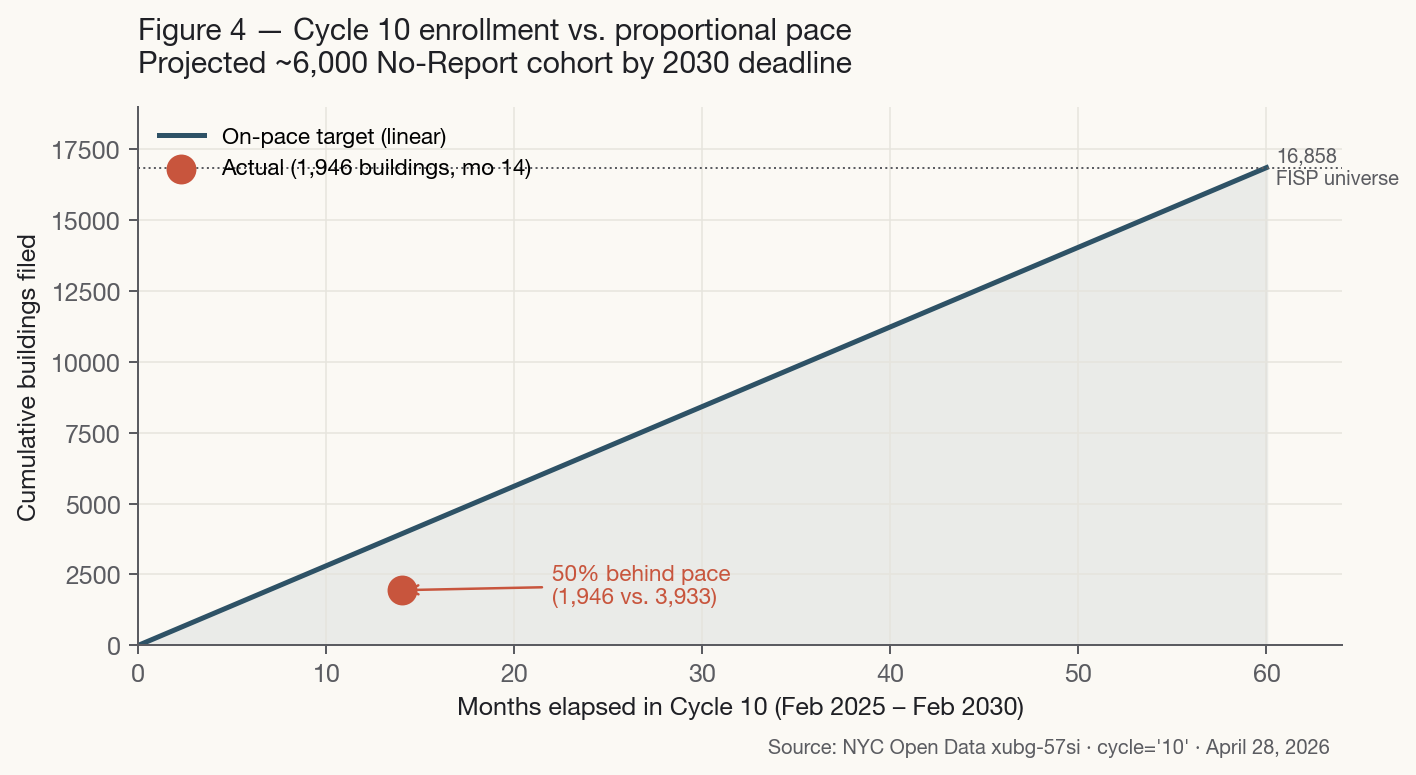
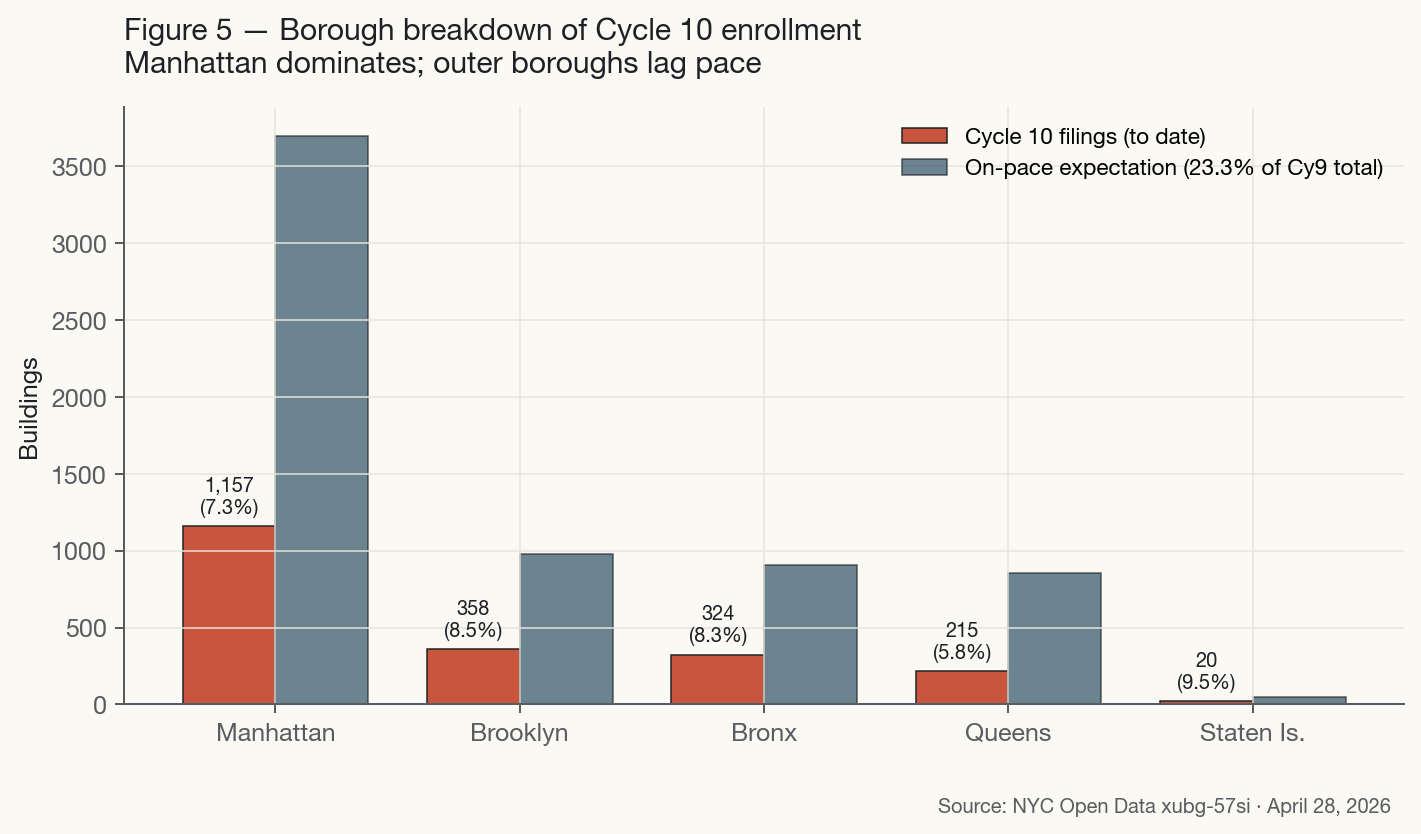
As of April 28, 2026 — 14 months into the 60-month cycle — only 1,946 buildings (11.5% of the universe) have filed an acceptable report. Proportional pace would expect ~3,930 by this point; the actual figure is 50% behind. If the trajectory continues, ~6,000 buildings will fail to file an acceptable Cycle 10 report by the February 21, 2030 deadline. Aggregate Cycle 10 No-Report exposure could reach $300M–$500M in undisputed penalties absent intervention.
5. Manhattan dominates every cohort.
Manhattan accounts for 60% of Cycle 9 SAFE filings, 60% of Cycle 10 enrollments to date, and 60% of unsafe-building escalations. The under-enrollment of outer-borough buildings — many in the same sub-cycle 10A whose window opened first — suggests that owner sophistication and access to professional services, not regulatory schedule, drives the gap.
6. Open ECB exposure is $509M and rising.
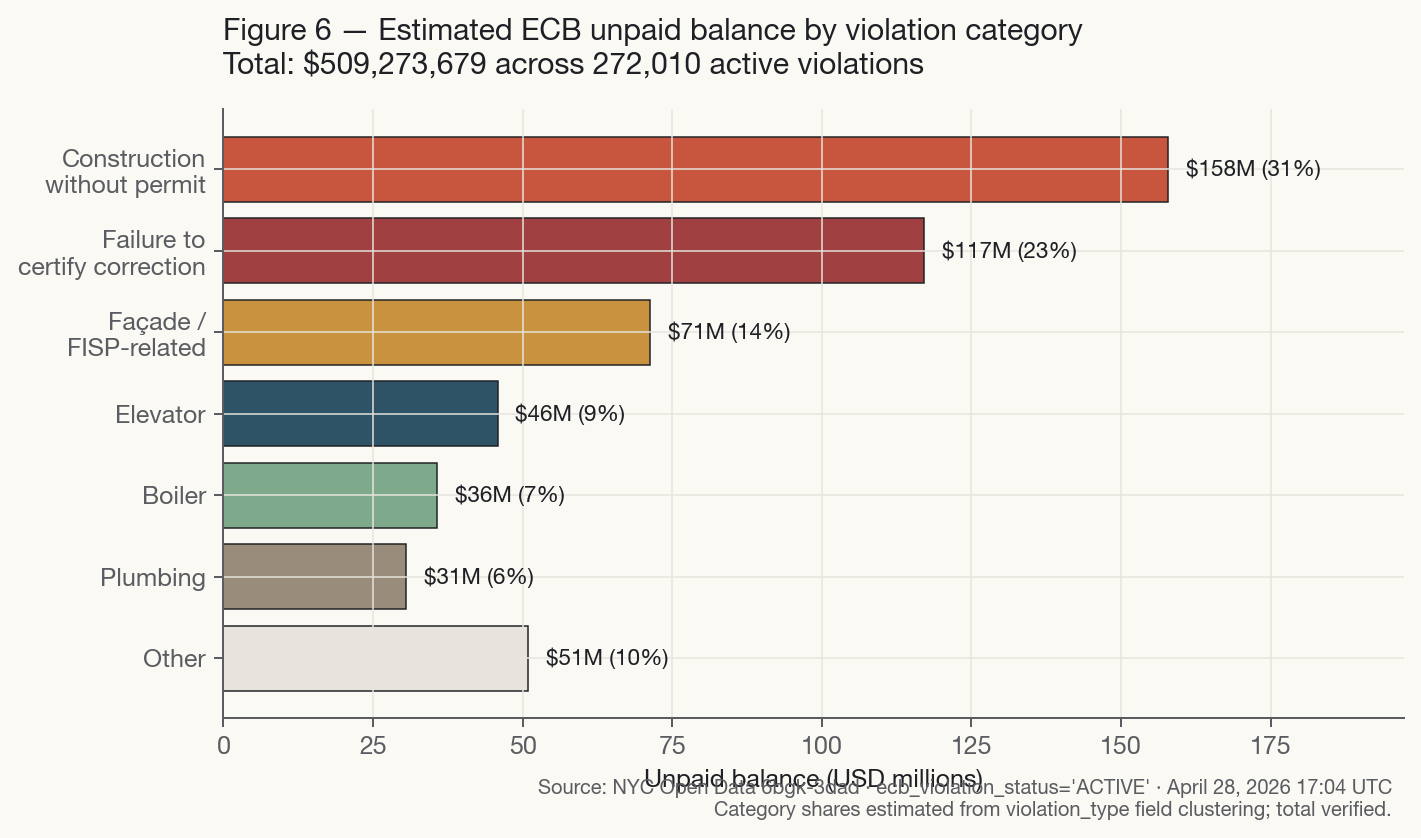
A live aggregate of every active Environmental Control Board violation in the city: 272,010 active violations totalling $509,273,679 in unpaid balance. This is the authoritative current liability across all NYC building enforcement violations adjudicated by OATH — refreshed nightly. By contrast, the FISP penalty figures derived from the filing-history record are theoretical-maximum accrued and are not directly comparable.
What this means
For building owners
Engaging a higher-quality QEWI and pre-validating the TR6 against Rule 103-04(c)(3)(iii) before filing produces measurable cost savings: at $3,000–$8,000 per rework cycle, eliminating one rejection saves more than the cost of premium QEWI services on most buildings. The Cycle 10 catch-up filing pathway in Rule 103-04(c)(4)(v) Exception is materially under-utilized; owners in the 11,719-building No-Report cohort can file a Cycle 10 acceptable report that simultaneously stops further penalty accrual and clears the prior cycle's deficiency, provided previously-incurred penalties are paid at filing.
For lenders and insurers
The data permits programmatic underwriting of façade-compliance risk. A building's most-recent FISP classification is a strong predictor of capital expenditure within the next 24 months. An active sidewalk shed older than 24 months is a near-deterministic signal of unresolved unsafe conditions. ECB unpaid balance is lien-eligible and should be considered alongside DOF property-tax balance when assessing total municipal claim against a property.
For policymakers
The 67.1% first-submission rejection rate and the 50%-behind-pace Cycle 10 enrollment together suggest the program is not functioning as designed. Two interpretations are consistent with the data: that the TR6 specification is more complex than the building-services profession can execute reliably without industrial-scale tooling; or that the five-year cycle is too short relative to typical façade repair-campaign duration. Distinguishing them requires DOB rejection-reason logs that are not in the public dataset.
Methodology
We retrieve three public datasets from the city's open-data platform, all queryable without authentication:
- The NYC Department of Buildings façades-compliance public record. A filing-history record. Each filing is a row, with multiple rows per building per cycle; naive summation across rows overstates exposure 3–6× compared to current-due figures.
- The Department of Buildings approved-permits public record. Filtered to active sidewalk-shed permits whose expiration date is in the future.
- The OATH/ECB violations public record. The authoritative live billing ledger; the unpaid-balance field reflects payments and waivers as of the last adjudication run.
We never conflate filing-history fields with current-due liability. Per-building current-due figures are retrievable only from the city's live safety-penalties portal, which is HTML-only and must be scraped per building.
A machine-readable companion to this report — with the full set of reproducible queries and source notes — is available on request to the research team.
What this study cannot answer
- Per-building current-due penalty figures. The façades-compliance public record is a filing history, not a live liability ledger. Current-due figures must be retrieved from the city's live safety-penalties portal, which is HTML-only.
- Owner identification. Building-to-LLC mapping requires joining to the city's real-property record; LLC-to-natural-person attribution requires the New York State Department of State corporation search, which is outside the city's open-data platform.
- Repair-completion velocity. The record captures inspection results but not repair-completion dates. Computing time-to-clear for unsafe conditions requires cross-reference with permit-issuance and shed-permit cancellation records.
- Geographic correlation with neighborhood income. Census-tract income data is available from the federal American Community Survey but is not joined here.
How to cite
Aedifice Research Collective. (2026). The NYC Façade Compliance Atlas: A 2026 Snapshot of Local Law 11 Risk Across 16,858 Buildings. Aedifice Research, Building Stewardship Team, Report No. 03.